30-39, 40-49, 50-59 .. తరగతులు .. రకపు తరగతులు .
విలీన
మినహాయింపు
నిరంతరం
ఏదికాదు
The correct Answer is:A
Step by step video, text & image solution for 30-39, 40-49, 50-59 .. తరగతులు .. రకపు తరగతులు . by Maths experts to help you in doubts & scoring excellent marks in Class 9 exams.
Updated on:21/07/2023Topper's Solved these Questions
Similar Questions
కింది పౌనఃపుణ్య విభాజనము నుండి రాశులు, వాణి పోనహపుణ్యములు గల పట్టిక తయారుచేయండి.

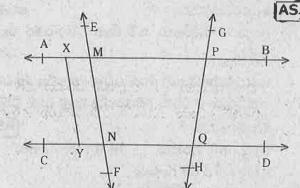
View Solutionఇచ్చిన పటంలో కింది వానిని గుర్తించి రాయుము. ఏవైనా 6 బిందువులు

View Solution30 विद्यार्थियों ने एक परीक्षा में निम्न अंक प्राप्त किए-
20,23,28,30,32,34,35,36,36,40,41,42,43,44,45,45,48,44,50,50,52,53,54,56,56,58,61,62,65,65
वर्ग अन्तराल 20-29, 30-39,40-49, 50-59 तथा 60-69 लेकर इन्हें बारंबारता बंटनीय रूप में दर्शाइये।
View SolutionFollowing are the marks obtained by 9 students in a Mathematics test : 50, 69, 20, 33, 53, 39, 40, 65, 59. The mean deviation from the median is :
View Solution30-39, 40-49, 50-59 .. తరగతులు .. రకపు తరగతులు .
View SolutionThe value of
(1.2.3…..9).(11.12.13…19).(21.22.23….29).(31.32.33……39).(41.42.43….49).(51.52.53…..59)……(91.92….99)
View Solutionगणित की परीक्षा में 9 विद्यार्थियों के अंक निम्न हैं 50, 69, 20, 33, 53, 39, 40, 65, 59 माध्यिका के सापेक्ष माध्य विचलन है
View SolutionDraw a cumulative frequency curve and cumulative frequency polygon for the following frequency distribution by less than method. Age (in yrs). 0-9 10-19 20-29 30-39 40-49 50-59 60-69 No. of Person 5 15 20 23 17 11 9
View SolutionClasses: 25-29 30-34 35-39 40-44 45-49 50-54 55-59 Frequency: 14 22 16 6 5 3 4 Find the mean for given data.
View SolutionFollowing are the marks obtained by 9 students in a mathematics test :
50, 69 , 20, 33, 53, 39, 40, 65 and 59
The mean deviation from the median is …………
View SolutionThe value of
(1.2.3…..9).(11.12.13…19).(21.22.23….29).(31.32.33……39).(41.42.43….49).(51.52.53…..59)……(91.92….99)
View SolutionWrite the class boundaries of the following classes : 25-29, 30-34, 35-39, 40-44, 45-49, 50 - 54
View SolutionSimplify: i29+i39+i49i30+i40+i50
View SolutionBy taking classes 30 - 40, 40 - 50, 50 - 60,.. ., construct a frequency table for the following data:
65 34 74 49 52 35
71 55 61 40 56 38
52 56 52 33 60 35
49 37 53 50 44 30
62 50 47 45 47 50
63 61 54 58 47 64
37 38 44 42 47 55
70 33 75 49 47 30
60 69
View SolutionConstruct a frequency distributions table from the following cumulatvive frequency table.
Class interval Cumulative Frequency 0−91510−192320−293830−395640−496850−5990
View SolutionDraw histograms for the following frequency distributions :
Class interval 30−3940−4950−5960−6970−79Frequency 24 16 09 15 20
View Solution
