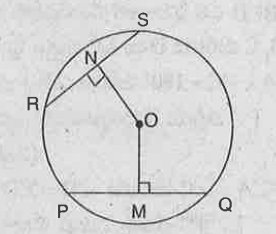
కింది పటంలో 'O' వృత్త కేంద్రం మరియు OM, ON లు జ్యులు PQ, RS ల పై కేంద్రం నుండి గీచిన లంబాలు OM=ON మరియు PQ=6 సెం.మీ. అయిన RS ను కన్నుకోండి.

Step by step video & image solution for కింది పటంలో 'O' వృత్త కేంద్రం మరియు OM, ON లు జ్యులు PQ, RS ల పై కేంద్రం నుండి గీచిన లంబాలు OM=ON మరియు PQ=6 సెం.మీ. అయిన RS ను కన్నుకోండి. by Maths experts to help you in doubts & scoring excellent marks in Class 9 exams.
Updated on:21/07/2023Topper's Solved these Questions
Similar Questions
పటంలో O వృత్త కేంద్రం. ఆయన దిగువ ఇవ్వబడిన భాగాల పేర్లు తెలపండి.
 ¯¯¯¯¯¯AO
View Solutionఏవైనా 3 ఆకరణీయ సంఖ్యలు రాయండి.
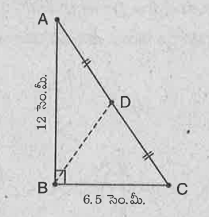
View Solution△ABC లో ∠ABC=90∘, AD=DC, AB=12 సెం.మీ. మరియు BC=6.5 సెం.మీ. అయిన △ADB వైశాల్యము కనుగొనండి.

View SolutionIdentify the cell organelle 'A' :-
ltimg src="https://d10lpgp6xz60nq.cloudfront.net/physics_images/ALN_BIO_C10_E08_018_Q01.png" width="80%"gt
View SolutionHow many lines of symmetry does the above figure have ?
View SolutionWhich of the following are correct chain isomers of butane ? (i)
View SolutionDetermine the point of symmetry of a regular hexagon.
View SolutionDtermine the images of the following figure about the given line :
View SolutionMatch the following Column A to Column B

View SolutionMatch the following Column A to Column B

View SolutionMatch the following Column A to Column B

View SolutionFind the area of the figure given below.

View SolutionThe inequation represented by the graph given below is :
View SolutionThe inequation that best describes the graph given below is _________
View SolutionThe inequation that best describes the following graph is _________
View SolutionWhich inequations represent the shaded region in the given figure
View Solution
