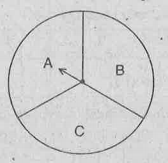
పటంలో చూపిన చక్రాన్ని ఒకసారి తిప్పినపుడు సాధ్యమయ్యే పర్యవసానాలు ఏవి? (సూచిక ఎక్కడైతే అగుతుంది దానిని పర్యవసానంగా తీసుకొంతము.)

Step by step video & image solution for పటంలో చూపిన చక్రాన్ని ఒకసారి తిప్పినపుడు సాధ్యమయ్యే పర్యవసానాలు ఏవి? (సూచిక ఎక్కడైతే అగుతుంది దానిని పర్యవసానంగా తీసుకొంతము.) by Maths experts to help you in doubts & scoring excellent marks in Class 9 exams.
Updated on:21/07/2023Topper's Solved these Questions
- సంభావ్యతBOOK - VGS PUBLICATION-BRILLIANT(TELUGU)CHAPTER - సంభావ్యతEXERCISE - Exercise
58 Videos
- వైశాల్యాలుBOOK - VGS PUBLICATION-BRILLIANT(TELUGU)CHAPTER - వైశాల్యాలుEXERCISE - Exercise
59 Videos
- సరళ రేఖలు మరియు కోణములుBOOK - VGS PUBLICATION-BRILLIANT(TELUGU)CHAPTER - సరళ రేఖలు మరియు కోణములుEXERCISE - Exercise
129 Videos
Similar Questions
ఒక నాణెన్నీ 100 సార్లు ఎగురవేసినప్పుడు పర్యవసానాలు కింది విధంగా ఉన్నాయి. బొమ్మ : 45 సార్లు , బొరుసు : 55 సార్లు అయిన . ప్రతి పర్యవసానం యొక్క సంభావ్యత కనుక్కోండి.
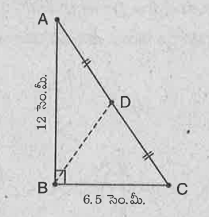
View Solution△ABC లో ∠ABC=90∘, AD=DC, AB=12 సెం.మీ. మరియు BC=6.5 సెం.మీ. అయిన △ADB వైశాల్యము కనుగొనండి.

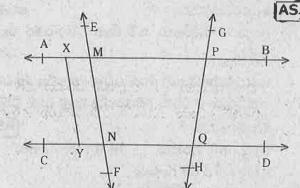
View Solutionఇచ్చిన పటంలో కింది వానిని గుర్తించి రాయుము. ఏవైనా 6 బిందువులు

View SolutionHow many lines of symmetry does the above figure have ?
View SolutionWhich of the following are correct chain isomers of butane ? (i)
View SolutionDetermine the point of symmetry of a regular hexagon.
View SolutionDtermine the images of the following figure about the given line :
View SolutionMatch the following Column A to Column B

View SolutionMatch the following Column A to Column B

View SolutionMatch the following Column A to Column B

View SolutionFind the area of the figure given below.

View SolutionThe area of the shaded part in the figure given below is ______.

View SolutionThe inequation represented by the graph given below is :
View SolutionThe inequation that best describes the graph given below is _________
View SolutionThe inequation that best describes the following graph is _________
View SolutionWhich inequations represent the shaded region in the given figure
View Solution
