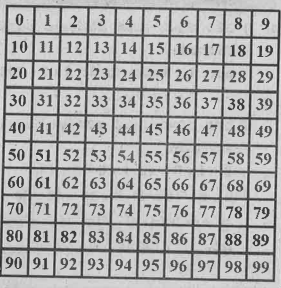
కింది పట్టికలో కొన్ని సంఖ్యలు ఇవ్వబడినవి. మనము అనుకున్న సంఖ్యలను చెప్పుటకు 8 సూచనలు ఇవ్వబడ్డాయి. యందు నాలుగు సూచనలు సత్యము. కానీ అవి సంఖ్యను కనుక్కోవడానికి ఉపయోగపదువు. నాలుగు సూచనలు సంఖ్యను కనుక్కోవడానికి కచ్చితంగా కావాలి. అయితే ఒక సంఖ్యను కనుక్కొనుటకు సూచనలు. ఆ సంఖ్య 7 యొక్క గుణిజము.

Step by step video & image solution for కింది పట్టికలో కొన్ని సంఖ్యలు ఇవ్వబడినవి. మనము అనుకున్న సంఖ్యలను చెప్పుటకు 8 సూచనలు ఇవ్వబడ్డాయి. యందు నాలుగు సూచనలు సత్యము. కానీ అవి సంఖ్యను కనుక్కోవడానికి ఉపయోగపదువు. నాలుగు సూచనలు సంఖ్యను కనుక్కోవడానికి కచ్చితంగా కావాలి. అయితే ఒక సంఖ్యను కనుక్కొనుటకు సూచనలు. ఆ సంఖ్య 7 యొక్క గుణిజము. by Maths experts to help you in doubts & scoring excellent marks in Class 9 exams.
Updated on:21/07/2023Topper's Solved these Questions
- గణితములో నిరూపణలుBOOK - VGS PUBLICATION-BRILLIANT(TELUGU)CHAPTER - గణితములో నిరూపణలుEXERCISE - Exercise
104 Videos
- ఉపరితల వైశాల్యములు మరియు ఘనపరిమాణములుBOOK - VGS PUBLICATION-BRILLIANT(TELUGU)CHAPTER - ఉపరితల వైశాల్యములు మరియు ఘనపరిమాణములుEXERCISE - Exercise
101 Videos
- చతుర్భుజాలుBOOK - VGS PUBLICATION-BRILLIANT(TELUGU)CHAPTER - చతుర్భుజాలుEXERCISE - Exercise
88 Videos
Similar Questions
కింది వాక్యములు సత్యమో లేక అసత్యమో లేక సందిగ్ధ వాక్యమో తెలియజేస్తూ వివరించండి.ఒక నెలలో 27 రోజులు కలవు.
View Solutionఈ కింద క్రమ పట్టకము యొక్కప్రక్కతల వైశాల్యము మరియు సంపూర్ణతల వైశాల్యము కనుగొనండి.

View Solutionకింది ప్రవచనాలు సత్యమో లేదా అసత్యమో తెలపండి. ప్రతి సమాంతర చతుర్భుజము ఒక ట్రెపీజియం అగును.
View SolutionHow many lines of symmetry does the above figure have ?
View SolutionWhich of the following are correct chain isomers of butane ? (i)
View SolutionDetermine the point of symmetry of a regular hexagon.
View SolutionDtermine the images of the following figure about the given line :
View SolutionMatch the following Column A to Column B

View SolutionMatch the following Column A to Column B

View SolutionMatch the following Column A to Column B

View SolutionFind the area of the figure given below.

View SolutionThe area of the shaded part in the figure given below is ______.

View SolutionThe inequation represented by the graph given below is :
View SolutionThe inequation that best describes the graph given below is _________
View SolutionThe inequation that best describes the following graph is _________
View SolutionWhich inequations represent the shaded region in the given figure
View Solution
