ஒரு வகுப்பில் கணித அலகுத் தேர்வில், 10 மாணவர்கள் 75 மதிப்பெண், 12 மாணவர்கள் 60 மதிப்பெண், 8 மாணவர்கள் 40 மதிப்பெண் மற்றும் 3 மாணவர்கள் 30 மதிப்பெண் பெற்றனர் எனில் மொத்தத்தில் சராசரி மதிப்பெண் என்ன?
Step by step video & image solution for ஒரு வகுப்பில் கணித அலகுத் தேர்வில், 10 மாணவர்கள் 75 மதிப்பெண், 12 மாணவர்கள் 60 மதிப்பெண், 8 மாணவர்கள் 40 மதிப்பெண் மற்றும் 3 மாணவர்கள் 30 மதிப்பெண் பெற்றனர் எனில் மொத்தத்தில் சராசரி மதிப்பெண் என்ன? by Maths experts to help you in doubts & scoring excellent marks in Class 9 exams.
Updated on:21/07/2023Topper's Solved these Questions
Similar Questions
நீங்கள் ஒரு தெருவில் நடந்து செல்கிறீர்கள். நீவீர் சந்தித்தவர்களில் ஒரு புதிய மனிதரைத்தேர்ந்தெடுக்கவும். அந்த மனிதரின் பிறந்தநாள் ஞாயிற்றுக்கிழமையாக இருக்க நிகழ்தகவு என்ன?
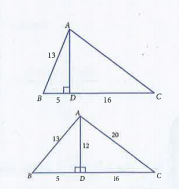
View Solutionகொடுக்கப்பட்டுள்ள படத்தில், cosC காண்க

View SolutionWrite the median class of the following distribution: Classes: 0-10 10-20 20-30 30-40 40-50 50-60 60-70 Frequency: 4 4 8 10 12 8 4
View Solutionयदि40 @ 8=−5,30 @ 3=−10 और20 @ 5=−4, तो 60 @ 3=?
View SolutionIn a class test in mathematics, 10 students scored 75 marks, 12 students scored 60 marks, 8 students scored 40 marks and 3 students scored 30 marks. Find the mean of their score.
View Solutionनिम्नलिखित सारणी का बहुलक ज्ञात कीजिए।
वर्ग0−1010−2020−3030−4040−5050−6060−70 आवृत्ति 8152040301412
View Solutionபின்வரும் கணங்களைப் பட்டியல் முறையில் எழுதுக ?C={x:x என்பது ஒரு முழுக் கன எண் மற்றும் 27 < x < 216}
View Solutionn(A)=25,n(B)=40,n(A∪B)=50 மற்றும் n(B)=25எனில்,n(A nn B) மற்றும்n(U) காண்க ?
View Solutionநாற்கரம் ABCD இல் ∠Aமற்றும்/_Bஇன்இருசமவெட்டிகள்Oஇல்சந்திக்கின்றன,எனில்,/_AOB இன் மதிப்பு
View Solutionகீழ்காண்பவைகளை பட்டியல் முறையில் எழுதுக.{x∈N:x2<121மற்றும்xஒருபகாஎண்ணாகும்}
View Solutionz1=2−iமற்றும்z2=−4+3iஎனில்,z_1 z_2மற்றும்z_1/z_2 -ன் நேர்மாறைக் காண்க.
View Solutionநிறை 'm' மின்சுமை 'eகொண்டஒருஎலக்ட்ரானின்நிறுத்துமின்னழுத்தம்V_0 எனில் நிறை திசைவேகம்
View SolutionIn a class test in English 10 students scored 75 marks, 12 students scored 60 marks, 8 scored 40 marks and 3 scored 30 marks, the mode for their score is
View SolutionRepresent the following data by means of historgram.
Weekly wages (in Rs.) 10-15 15-20 20-25 25-30 30-40 40-60 60-80
No. of workers (Frequency): 7 9 8 5 12 12 8
View SolutionWrite the median class of the following distribution: Classes: 0-10 10-20 20-30 30-40 40-50 50-60 60-70 Frequency: 4 4 8 10 12 8 4
View Solution
