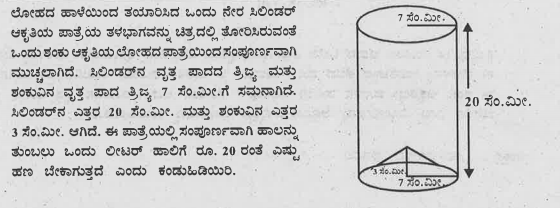
ಲೋಹದ ಹಾಳೆಯಿಂದ ತಯಾರಿಸಿದ ಒಂದು ನೇರ ಸಿಲಿಂಡರ್
ಆಕೃತಿಯ ಪಾತ್ರೆಯ ತಳಭಾಗವನ್ನು ಚಿತ್ರದಲ್ಲಿ ತೋರಿಸಿರುವಂತೆ
ಒಂದು ಶಂಕು ಆಕೃತಿಯ ಲೋಹದ ಪಾತ್ರೆಯಿಂದ ಸಂಪೂರ್ಣವಾಗಿ
ಮುಚ್ಚಲಾಗಿದೆ. ಸಿಲಿಂಡರ್ನ ವೃತ್ತ ಪಾದದ ತ್ರಿಜ್ಯ ಮತ್ತು
ಶಂಕುವಿನ ವೃತ್ತ ಪಾದ ತ್ರಿಜ್ಯ 7 ಸೆಂ.ಮೀ.ಗೆ ಸಮನಾಗಿದೆ.
ಸಿಲಿಂಡರ್ನ ಎತ್ತರ 20 ಸೆಂ.ಮೀ. ಮತ್ತು ಶಂಕುವಿನ ಎತ್ತರ
3 ಸೆಂ.ಮೀ. ಆಗಿದೆ. ಈ ಪಾತ್ರೆಯಲ್ಲಿ ಸಂಪೂರ್ಣವಾಗಿ ಹಾಲನ್ನು
ತುಂಬಲು ಒಂದು ಲೀಟರ್ ಹಾಲಿಗೆ ರೂ. 20 ರಂತೆ ಎಷ್ಟು
ಹಣ ಬೇಕಾಗುತ್ತದೆ ಎಂದು ಕಂಡುಹಿಡಿಯಿರಿ.

Step by step video & image solution for ಲೋಹದ ಹಾಳೆಯಿಂದ ತಯಾರಿಸಿದ ಒಂದು ನೇರ ಸಿಲಿಂಡರ್ ಆಕೃತಿಯ ಪಾತ್ರೆಯ ತಳಭಾಗವನ್ನು ಚಿತ್ರದಲ್ಲಿ ತೋರಿಸಿರುವಂತೆ ಒಂದು ಶಂಕು ಆಕೃತಿಯ ಲೋಹದ ಪಾತ್ರೆಯಿಂದ ಸಂಪೂರ್ಣವಾಗಿ ಮುಚ್ಚಲಾಗಿದೆ. ಸಿಲಿಂಡರ್ನ ವೃತ್ತ ಪಾದದ ತ್ರಿಜ್ಯ ಮತ್ತು ಶಂಕುವಿನ ವೃತ್ತ ಪಾದ ತ್ರಿಜ್ಯ 7 ಸೆಂ.ಮೀ.ಗೆ ಸಮನಾಗಿದೆ. ಸಿಲಿಂಡರ್ನ ಎತ್ತರ 20 ಸೆಂ.ಮೀ. ಮತ್ತು ಶಂಕುವಿನ ಎತ್ತರ 3 ಸೆಂ.ಮೀ. ಆಗಿದೆ. ಈ ಪಾತ್ರೆಯಲ್ಲಿ ಸಂಪೂರ್ಣವಾಗಿ ಹಾಲನ್ನು ತುಂಬಲು ಒಂದು ಲೀಟರ್ ಹಾಲಿಗೆ ರೂ. 20 ರಂತೆ ಎಷ್ಟು ಹಣ ಬೇಕಾಗುತ್ತದೆ ಎಂದು ಕಂಡುಹಿಡಿಯಿರಿ. by Maths experts to help you in doubts & scoring excellent marks in Class 10 exams.
Updated on:21/07/2023Topper's Solved these Questions
Similar Questions
ಒಂದು ಸಮಾಂತರ ಶ್ರೇಢಿಯ n ನೇ ಪದ 5n+3 ಆದಾಗ, ಸಮಾಂತರ ಶ್ರೇಢಿಯ 3ನೇ ಪದವು
View Solutionಕ್ರಿಕೆಟ್ ತಂಡವೊಂದರ ತರಬೇತುಗಾರ್ತಿಯು 7 ಬ್ಯಾಟ್ ಗಳುಮತ್ತು 6 ಚೆಂಡುಗಳನ್ನು Rs.3800 ಕೈ ಕೊಳ್ಳುತ್ತಾರೆ. ಆ ಬಳಿಕ 3 ಬ್ಯಾಟ್ ಗಳುಮತ್ತು 5 ಚೆಂಡುಗಳನ್ನು ಅವರು Rs. 1750ಕೈ ಕೊಳ್ಳುತ್ತಾರೆ. ಪ್ರತಿಯೊಂದು ಬ್ಯಾಟ್ ಮತ್ತು ಪ್ರತಿಯೊಂದು ಚೆಂಡಿನ ಬೆಲೆಗಳನ್ನು ಕಂಡುಹಿಡಿಯಿರಿ.
View SolutionHow many lines of symmetry does the above figure have ?
View SolutionWhich of the following are correct chain isomers of butane ? (i)
View SolutionDetermine the point of symmetry of a regular hexagon.
View SolutionDtermine the images of the following figure about the given line :
View SolutionMatch the following Column A to Column B

View SolutionMatch the following Column A to Column B

View SolutionMatch the following Column A to Column B

View SolutionFind the area of the figure given below.

View SolutionThe area of the shaded part in the figure given below is ______.

View SolutionThe inequation represented by the graph given below is :
View SolutionThe inequation that best describes the graph given below is _________
View SolutionThe inequation that best describes the following graph is _________
View SolutionWhich inequations represent the shaded region in the given figure
View SolutionMatch the followings (column I with column II)
ltimg src="https://d10lpgp6xz60nq.cloudfront.net/physics_images/NCERT_BIO_XI_C03_E01_011_Q01.png" width="80%"gt
View Solution
