Study the following graph carefully and answer the questions that
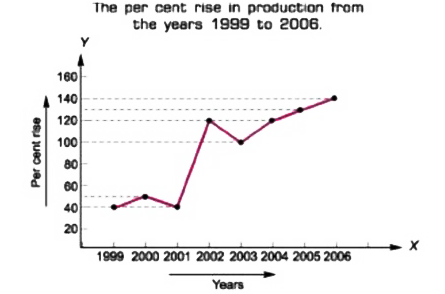
If the production in year 1998 was 1000 units , how much was the production in year 2002 ?
35280 units
64680 units
46200
None of these
The correct Answer is:D
Step by step video, text & image solution for Study the following graph carefully and answer the questions that If the production in year 1998 was 1000 units , how much was the production in year 2002 ? by Maths experts to help you in doubts & scoring excellent marks in Class 14 exams.
Updated on:21/07/2023Topper's Solved these Questions
- LINE GRAPHBOOK - ARIHANT SSCCHAPTER - LINE GRAPHEXERCISE - FAST TRACK PRACTICE
43 Videos
- INDICES AND SURDSBOOK - ARIHANT SSCCHAPTER - INDICES AND SURDSEXERCISE - HIGHER SKILL LEVEL QUESTIONS
17 Videos
- LINEAR EQUATIONSBOOK - ARIHANT SSCCHAPTER - LINEAR EQUATIONSEXERCISE - Higher Skill Level Questions
7 Videos
Similar Questions
Study the following graph carefully and answer the given questions.
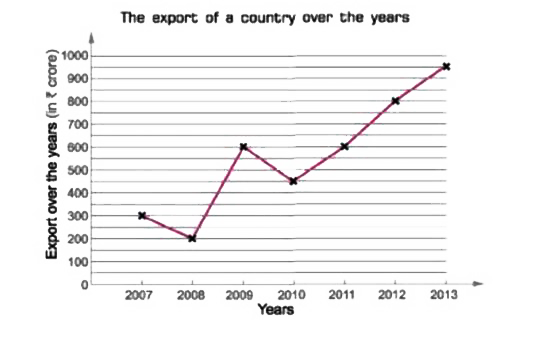
What is the difference in exports in the years 2009 and 2010 ?
View SolutionStudy the following graph carefully to answer the question given below:
Given below is the demand and production of 6 brands (in units) of a product in the year 2016.
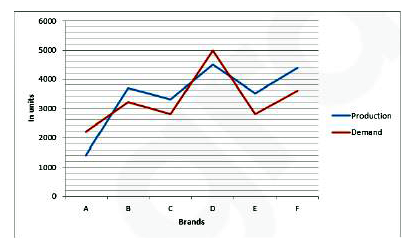
If the demand for brand C product increase by 75% then to meet the demand production should be increased by what percent?
View Solution
Knowledge Check
Study the following graph carefully and answer the questions that
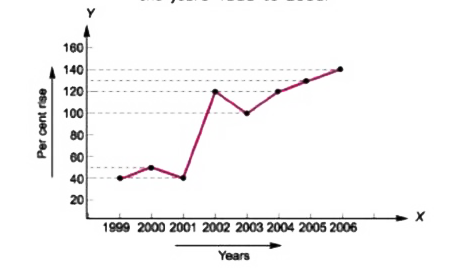
For how many years , the percent rise was more than 100 % ?AOneBTwoCThreeDNone of theseStudy the following graph carefully and answer the questions that
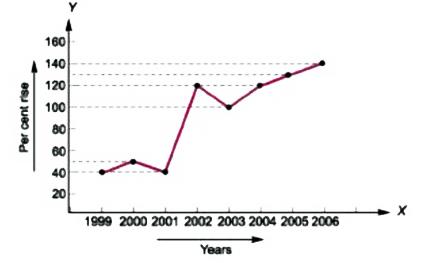
What was the average of percent rise over the given years ?A1.1B1.05C100.5%D92.5%Study the following graph carefully and answer the questions -----
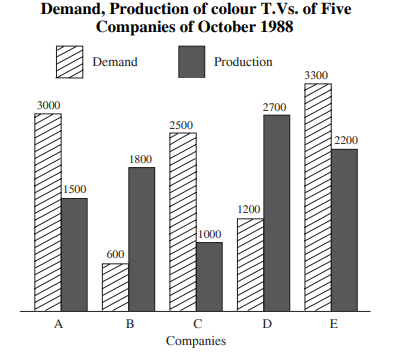
The production of company D is approximately how many times that of the production of the company A ?A1.8B1.5C2.5D1.11
Study the following graph carefully to answer the question given below:
Given below is the demand and production of 6 brands (in units) of a product in the year 2016.
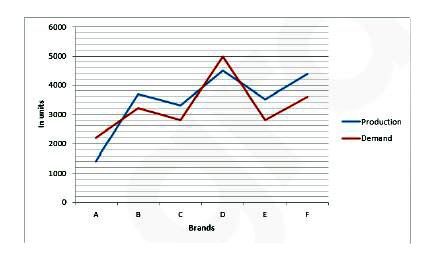
The demand for brand D product fell. The new demand is 20% less than its production. Find by what percentage demand fell?
View SolutionStudy the following graph carefully and answer the questions that
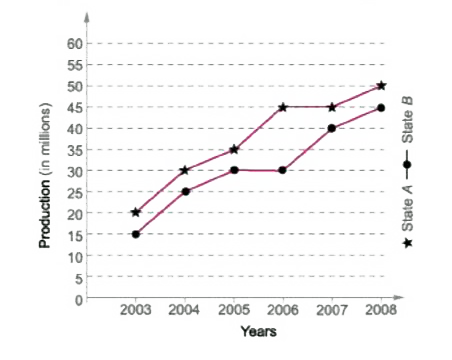
What was the average population of State B ( in millions ) for the years together ?
View SolutionStudy the following graph carefully and answer the questions that
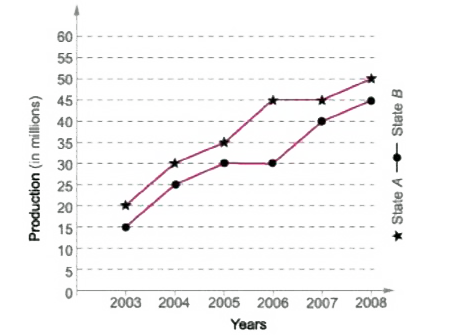
What was the percent rise in population of State A in 2007 from the previous year ?
View SolutionStudy the following graph carefully and answer the following questions -----
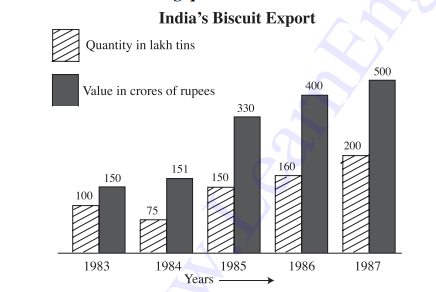
In which year the value per tins was minimum ?
View SolutionStudy the following graph carefully and answer the questions that follow
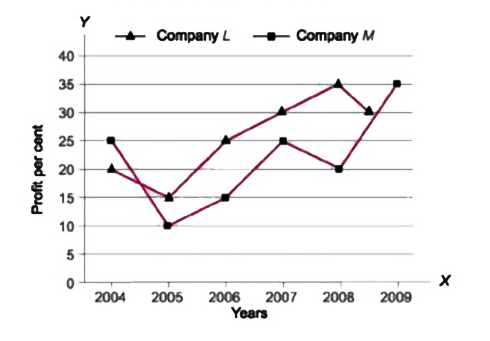
What was the percentage increase in percent rise in profit of company M in the year 2009 from the previous year ?
View Solution
