Study the following graph carefully and answer the questions that follow
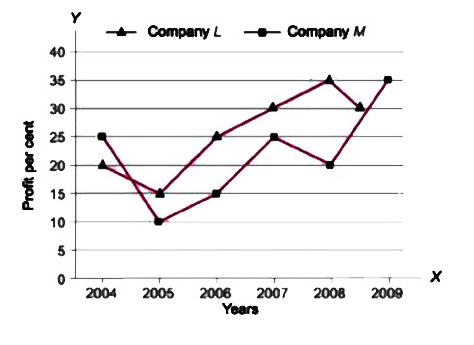
Which of the following statements is true with respect to the above graph ?
Company M made the highest profit in the year 2009
Company L made the least profit in the year 2005
The ratio of the profits earned by company L and company M in the year 2006 was 6:5
Company L made the highest profit in the year 2008
The correct Answer is:A
Step by step video, text & image solution for Study the following graph carefully and answer the questions that follow Which of the following statements is true with respect to the above graph ? by Maths experts to help you in doubts & scoring excellent marks in Class 14 exams.
Topper's Solved these Questions
- BOOK - ARIHANT SSCCHAPTER - LINE GRAPHEXERCISE - FAST TRACK PRACTICE43videos
LINE GRAPH
- BOOK - ARIHANT SSCCHAPTER - INDICES AND SURDSEXERCISE - HIGHER SKILL LEVEL QUESTIONS17videos
INDICES AND SURDS
- BOOK - ARIHANT SSCCHAPTER - LINEAR EQUATIONSEXERCISE - Higher Skill Level Questions7videos
LINEAR EQUATIONS
Similar Questions
Read the following graph and answer the following question
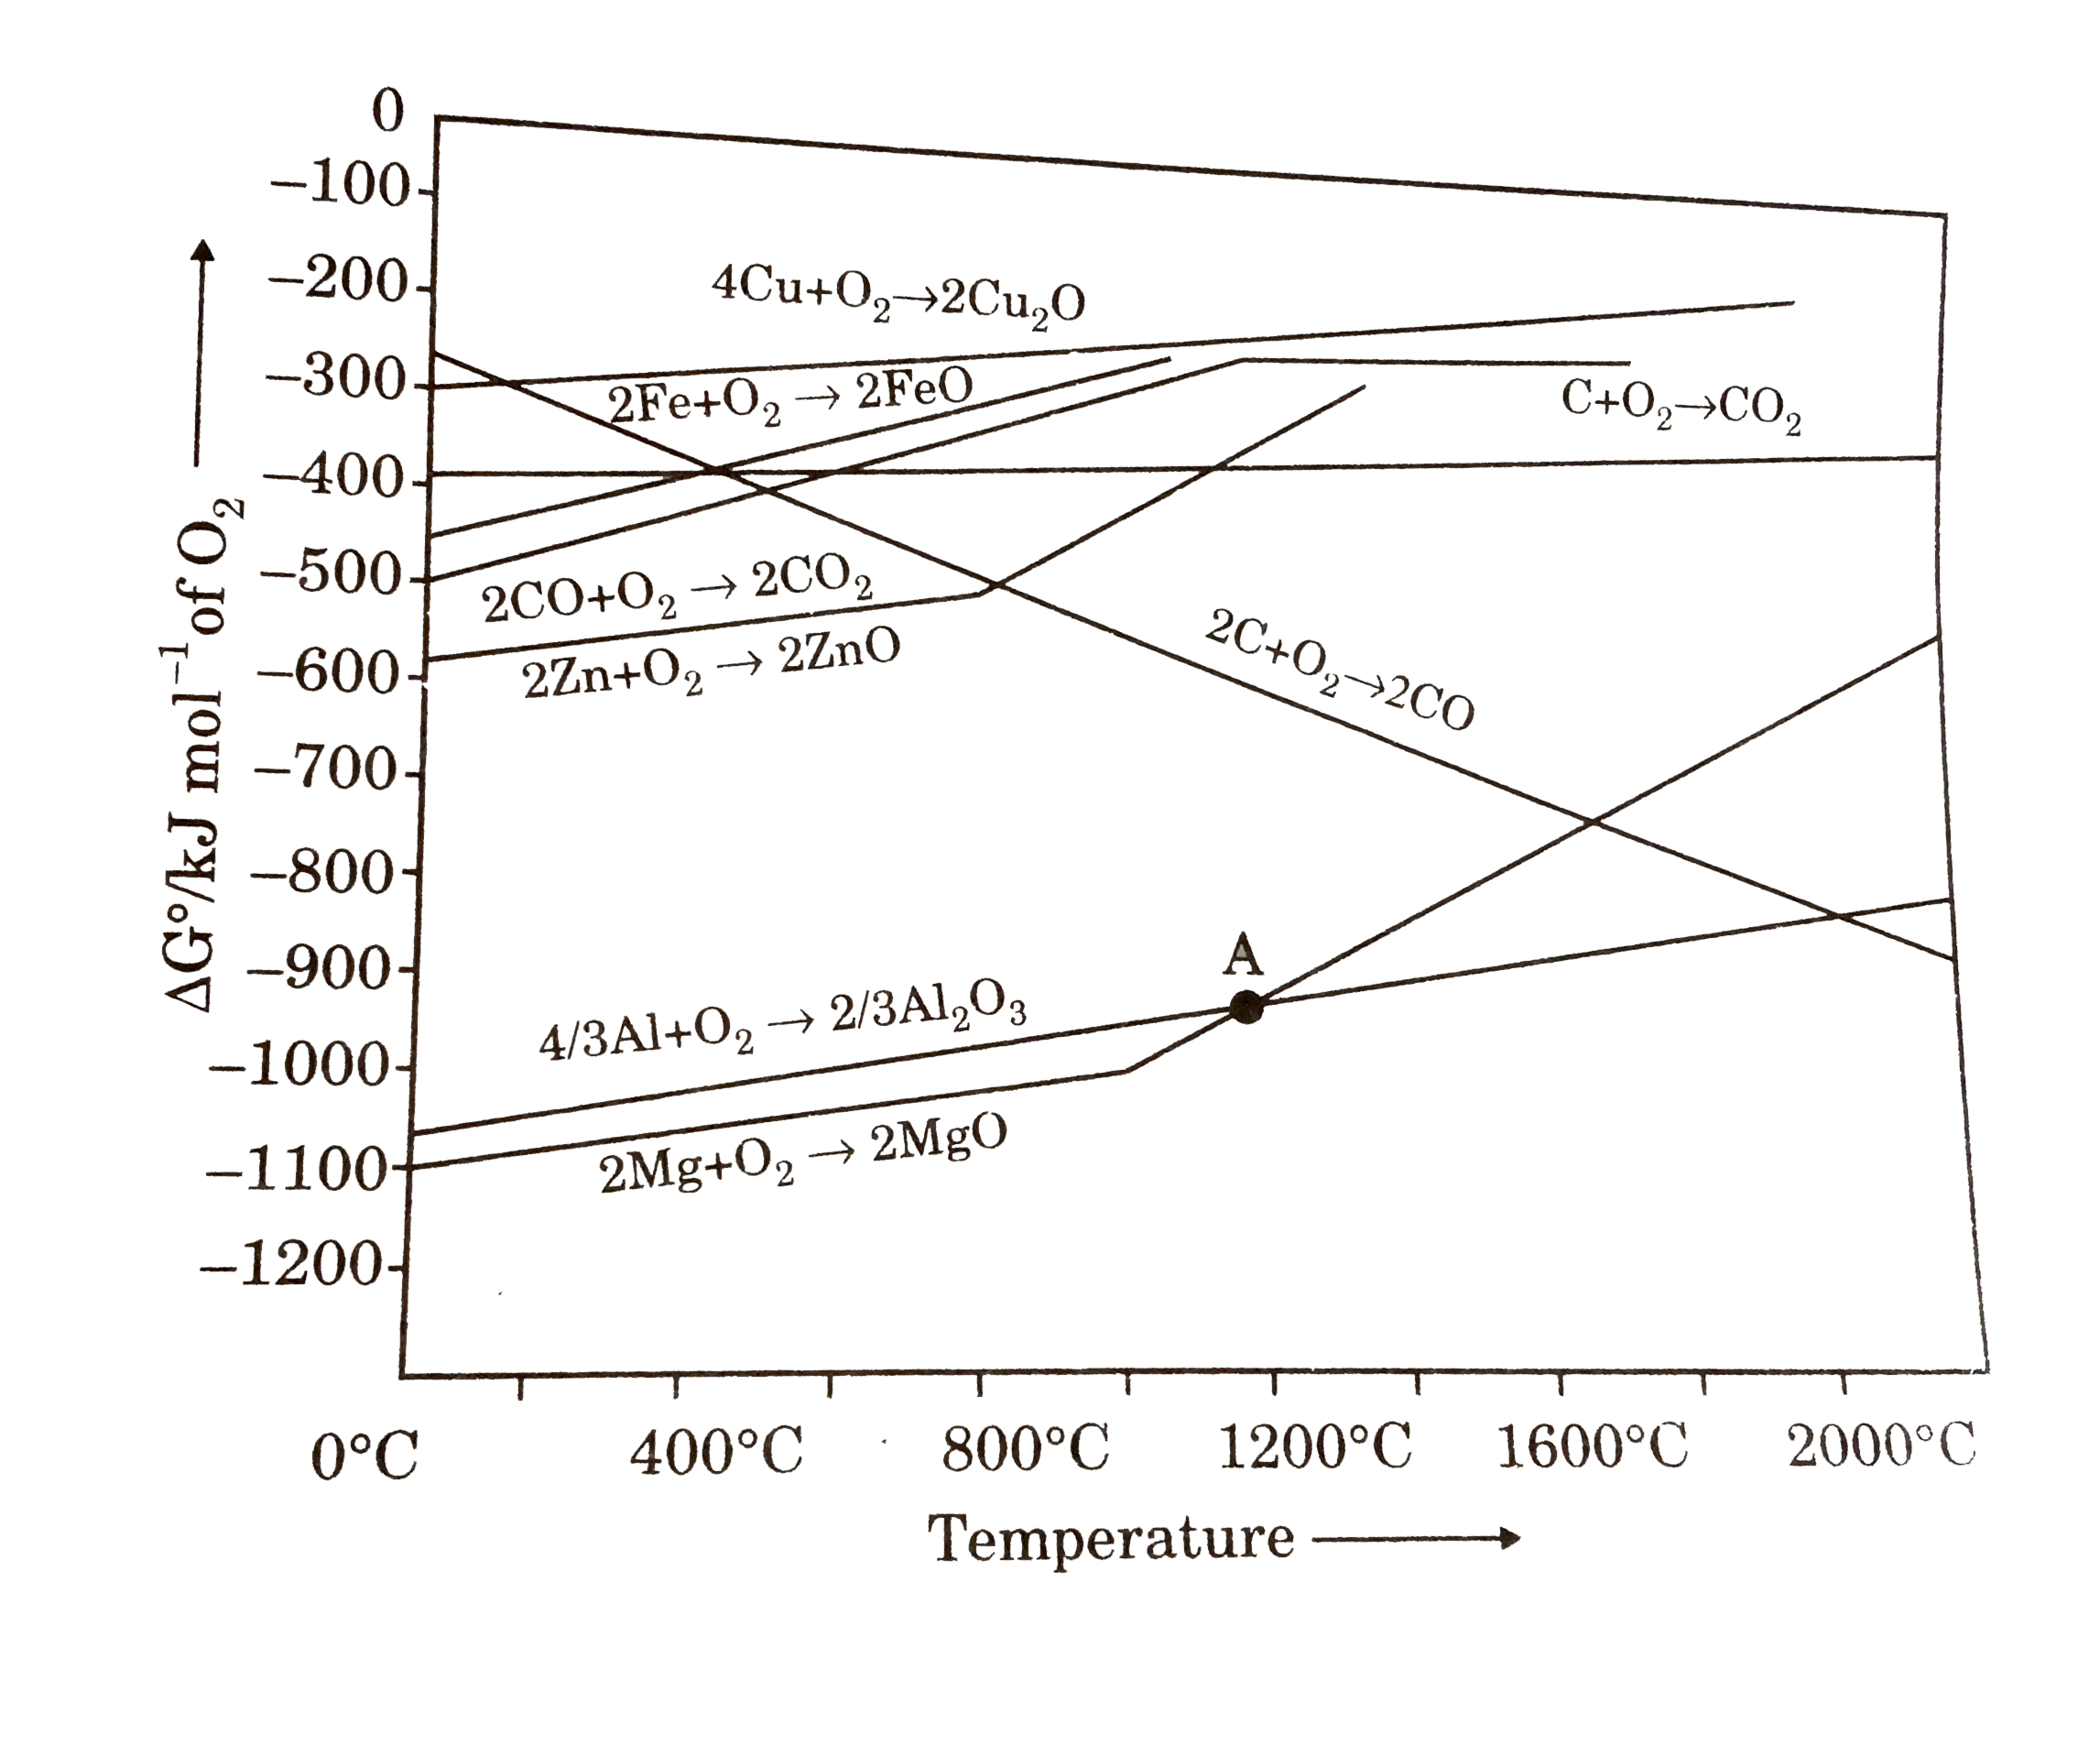
Which of the following statement is true?View SolutionStudy the following graph carefully and answer the questions that follow
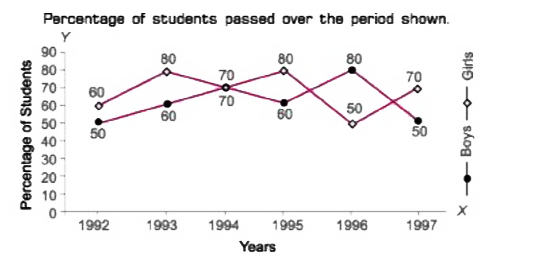
In which of the following years was the improvement of girls maximum as compared to that of previous years ?View Solution
Knowledge Check
- Question 1 - Select One
Study the following bar graph and answer the question that follows.
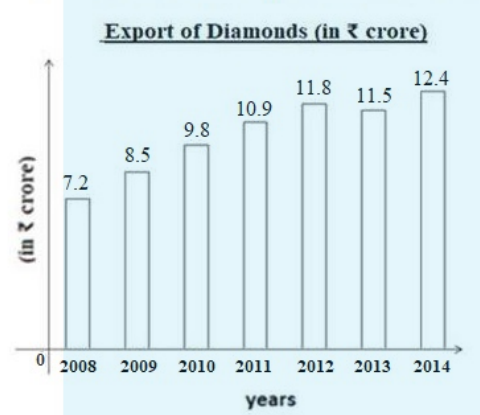
In which year was the maximin percentage increase in diamonds exports compared to the previous year?A2014B2009C2010D2012 - Question 2 - Select One
Examine the following graph carefully and answer the questions given below it :
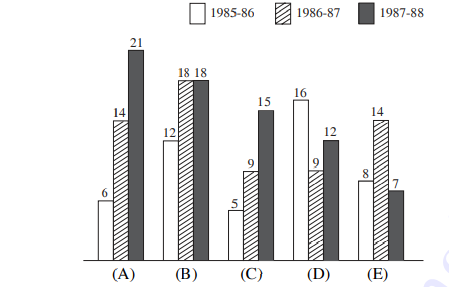
Which of the following statements is false ?AStates A and E showed the same production in 1986-87BThere was no improvement in the production of cotton in state B during 1987-88CState A has produced maximum cotton during the given periodDProducts of states C and D together is equal to that of state B during 1986-87 - Question 3 - Select One
Study the graph carefully and answer the following questions.
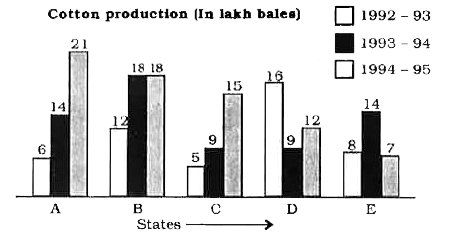
Which of the following statement is false ?AState A and E showed the same production in 1993-94.BThere was no improvement in the production of cotton in state B during 1994-95.CState A has produced maximum cotton during the given period.DProduction of state C and D together is equal to that of state B dring 1993-94.
Study the following graph carefully and answer the questions that follow
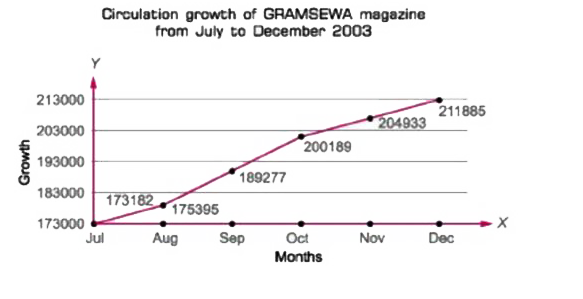
The growth rate is very marginal during the month ofView SolutionStudy the following graphs carefully and answer the questions that follow :
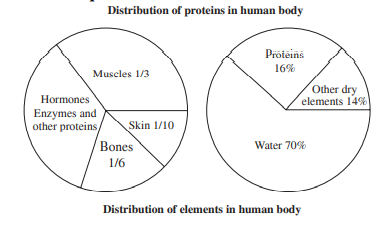
What percent of the total weight of the human body is equivalent to the weight of the skin in the human body ?View SolutionStudy the following graphs carefully and answer the questions that follow :
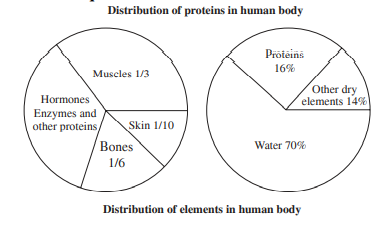
In the human body what is made of neither bones nor skin ?View SolutionStudy the following graph carefully and answer the questions given below –
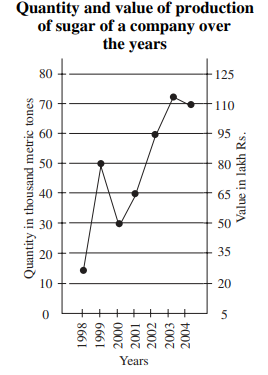
In which of the following years was the value of sugar per metric ton the lowest among the given years?View SolutionStudy the following graphs carefully and answer the questions that follow :
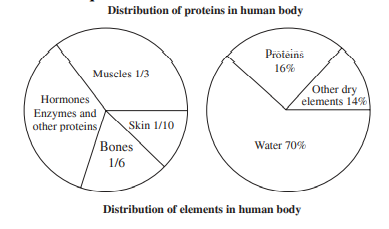
What is the ratio of the distribution of proteins in the muscles to that of the distribution of proteins in the bones ?View Solution

