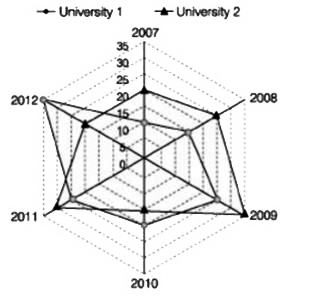
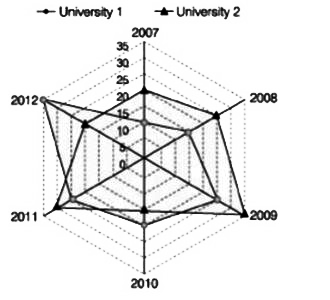
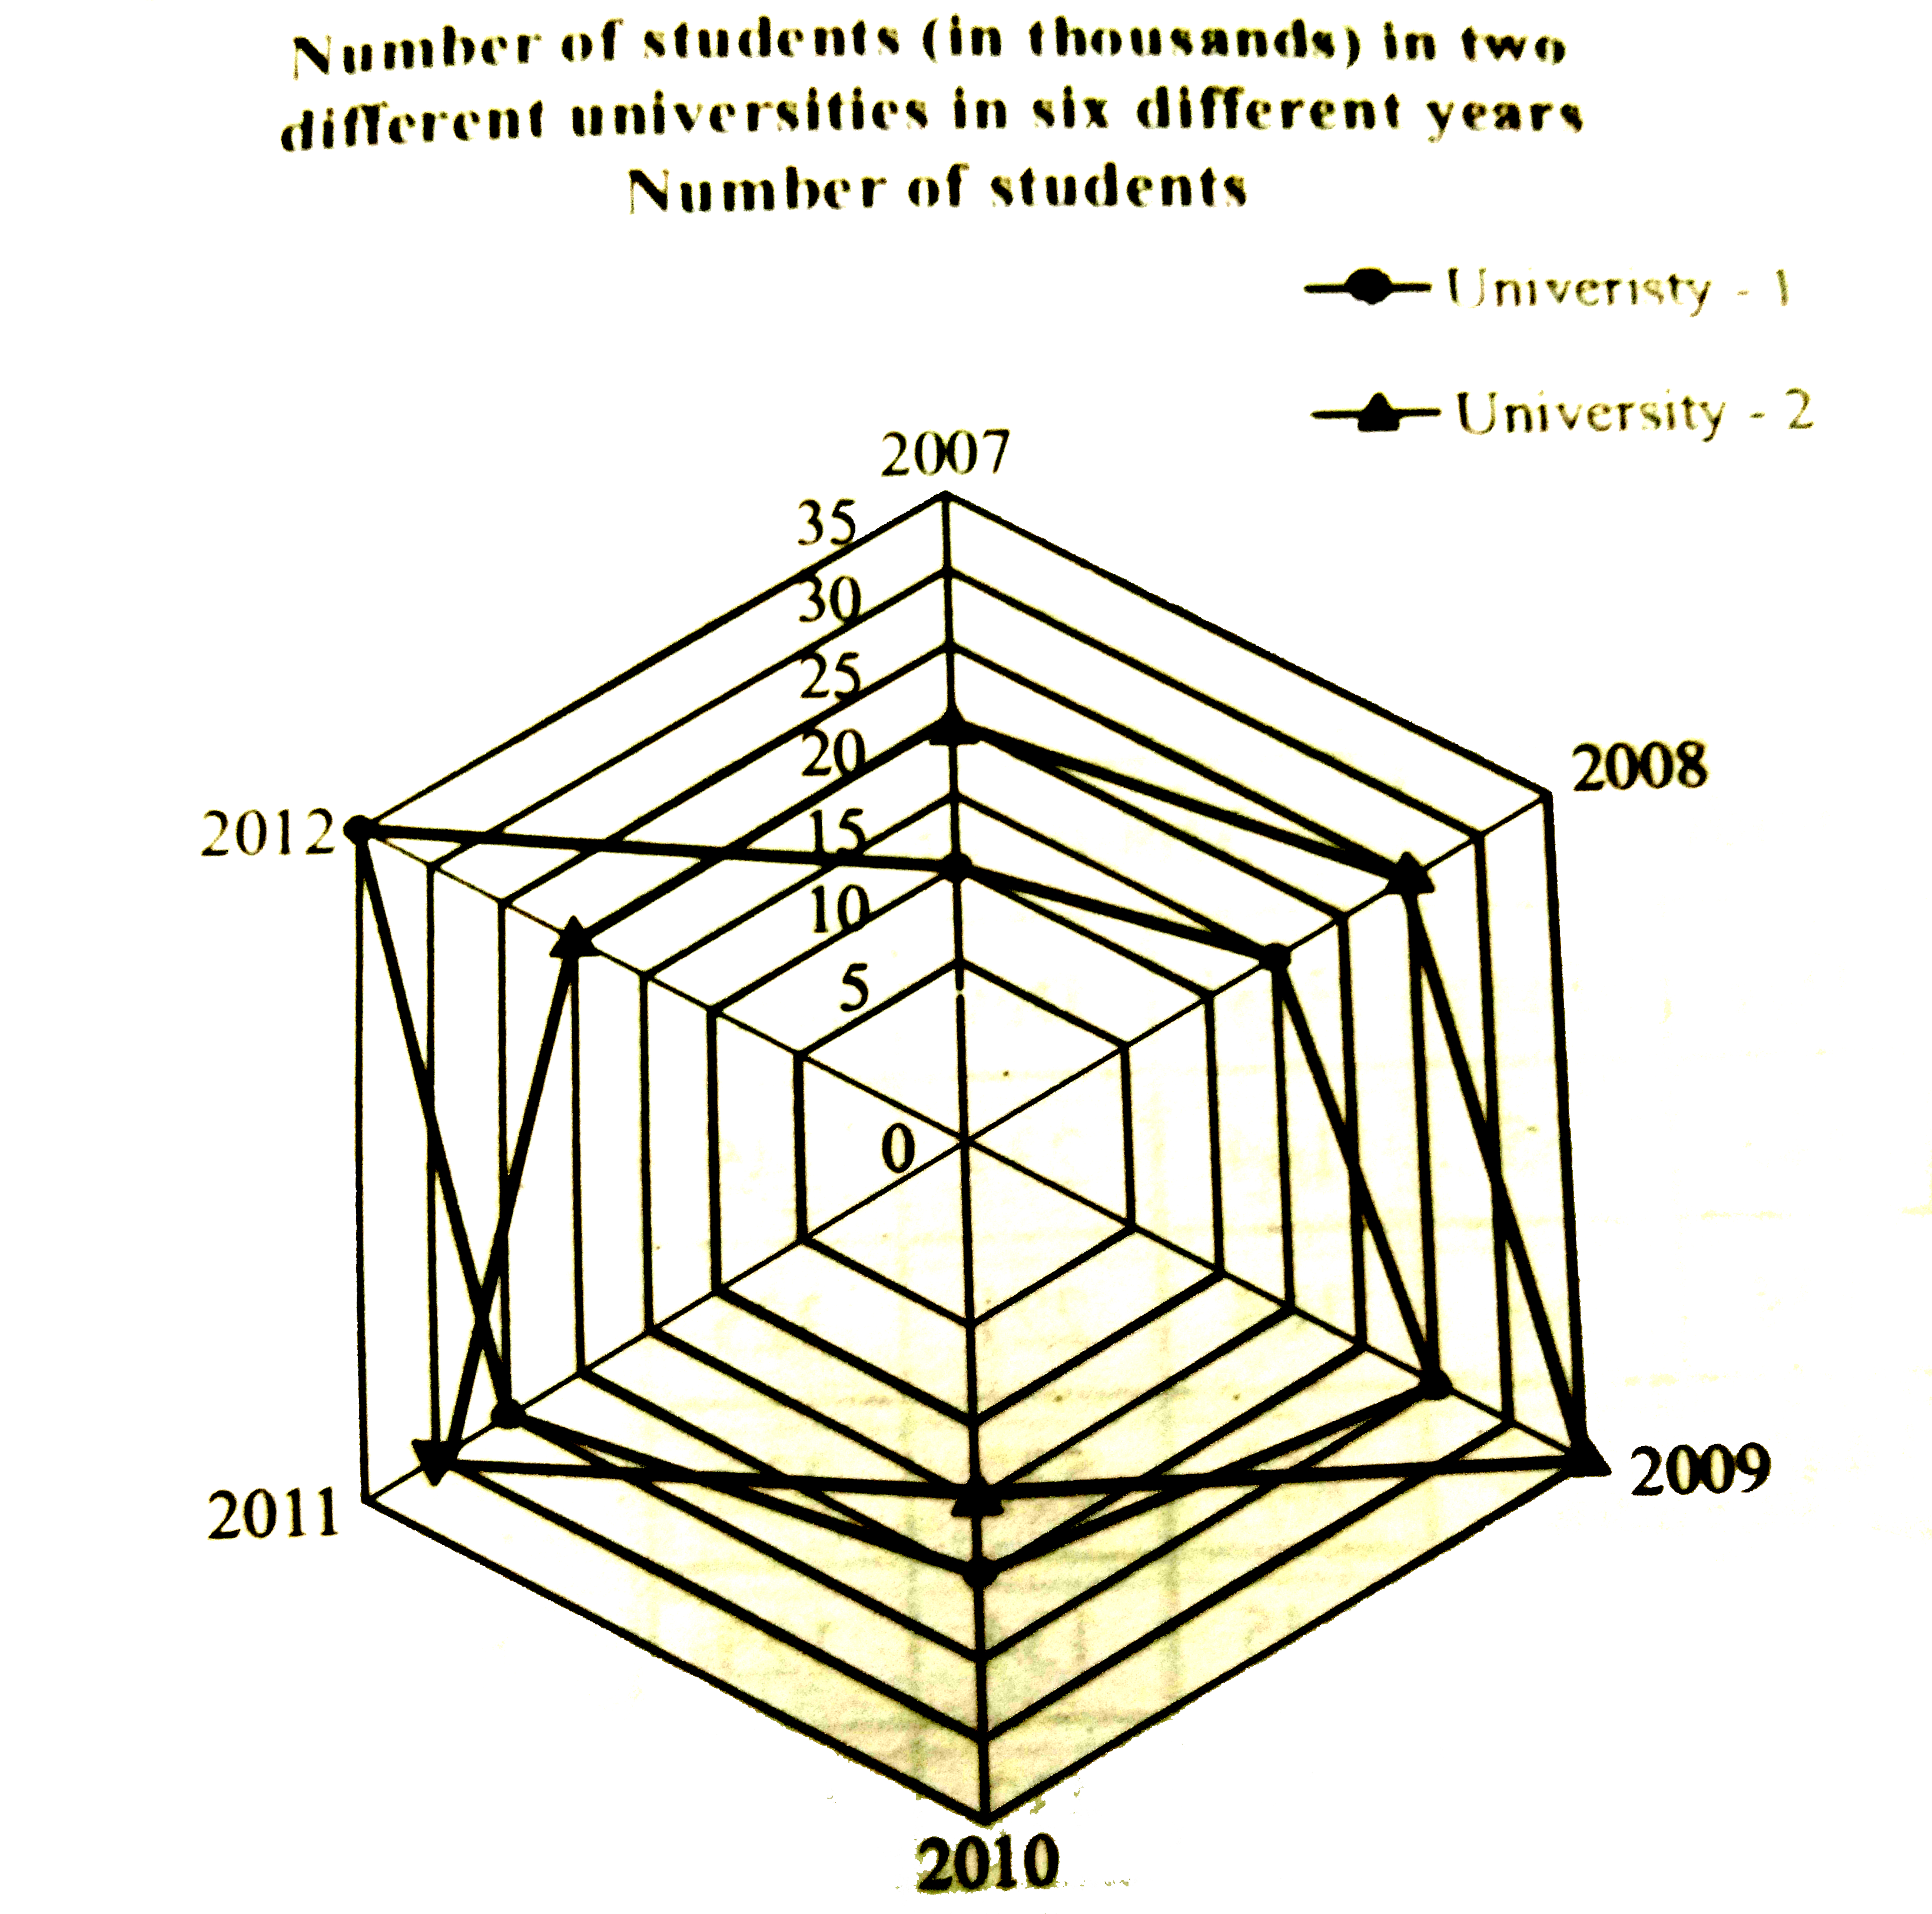
Directions (Q. Nos. 11-15) Study the radar graph carefully and answer the questions that follow.
Number of students (in thousand) in two
different universities in six different years.
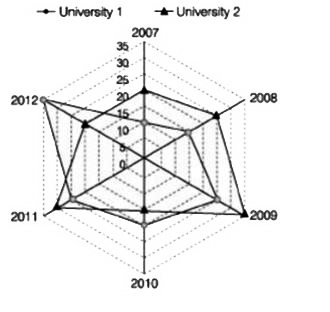
If 25% of the students in University 2 in the year 2010 were females, what was the number of male students in the University 2 in the same year?
11250
12350
12500
11500
The correct Answer is:A
Step by step video, text & image solution for Directions (Q. Nos. 11-15) Study the radar graph carefully and answer the questions that follow. Number of students (in thousand) in two different universities in six different years. If 25% of the students in University 2 in the year 2010 were females, what was the number of male students in the University 2 in the same year? by Maths experts to help you in doubts & scoring excellent marks in Class 14 exams.
Updated on:21/07/2023Topper's Solved these Questions
- MIXED GRAPHBOOK - ARIHANT SSCCHAPTER - MIXED GRAPHEXERCISE - Exercise Base Level Questions
20 Videos
- MENSURATIONBOOK - ARIHANT SSCCHAPTER - MENSURATIONEXERCISE - TEST OF YOUR LEARNING
18 Videos
- MIXTURE OR ALLIGATION BOOK - ARIHANT SSCCHAPTER - MIXTURE OR ALLIGATION EXERCISE - HIGHER SKILL LEVEL QUESTIONS
16 Videos
Similar Questions
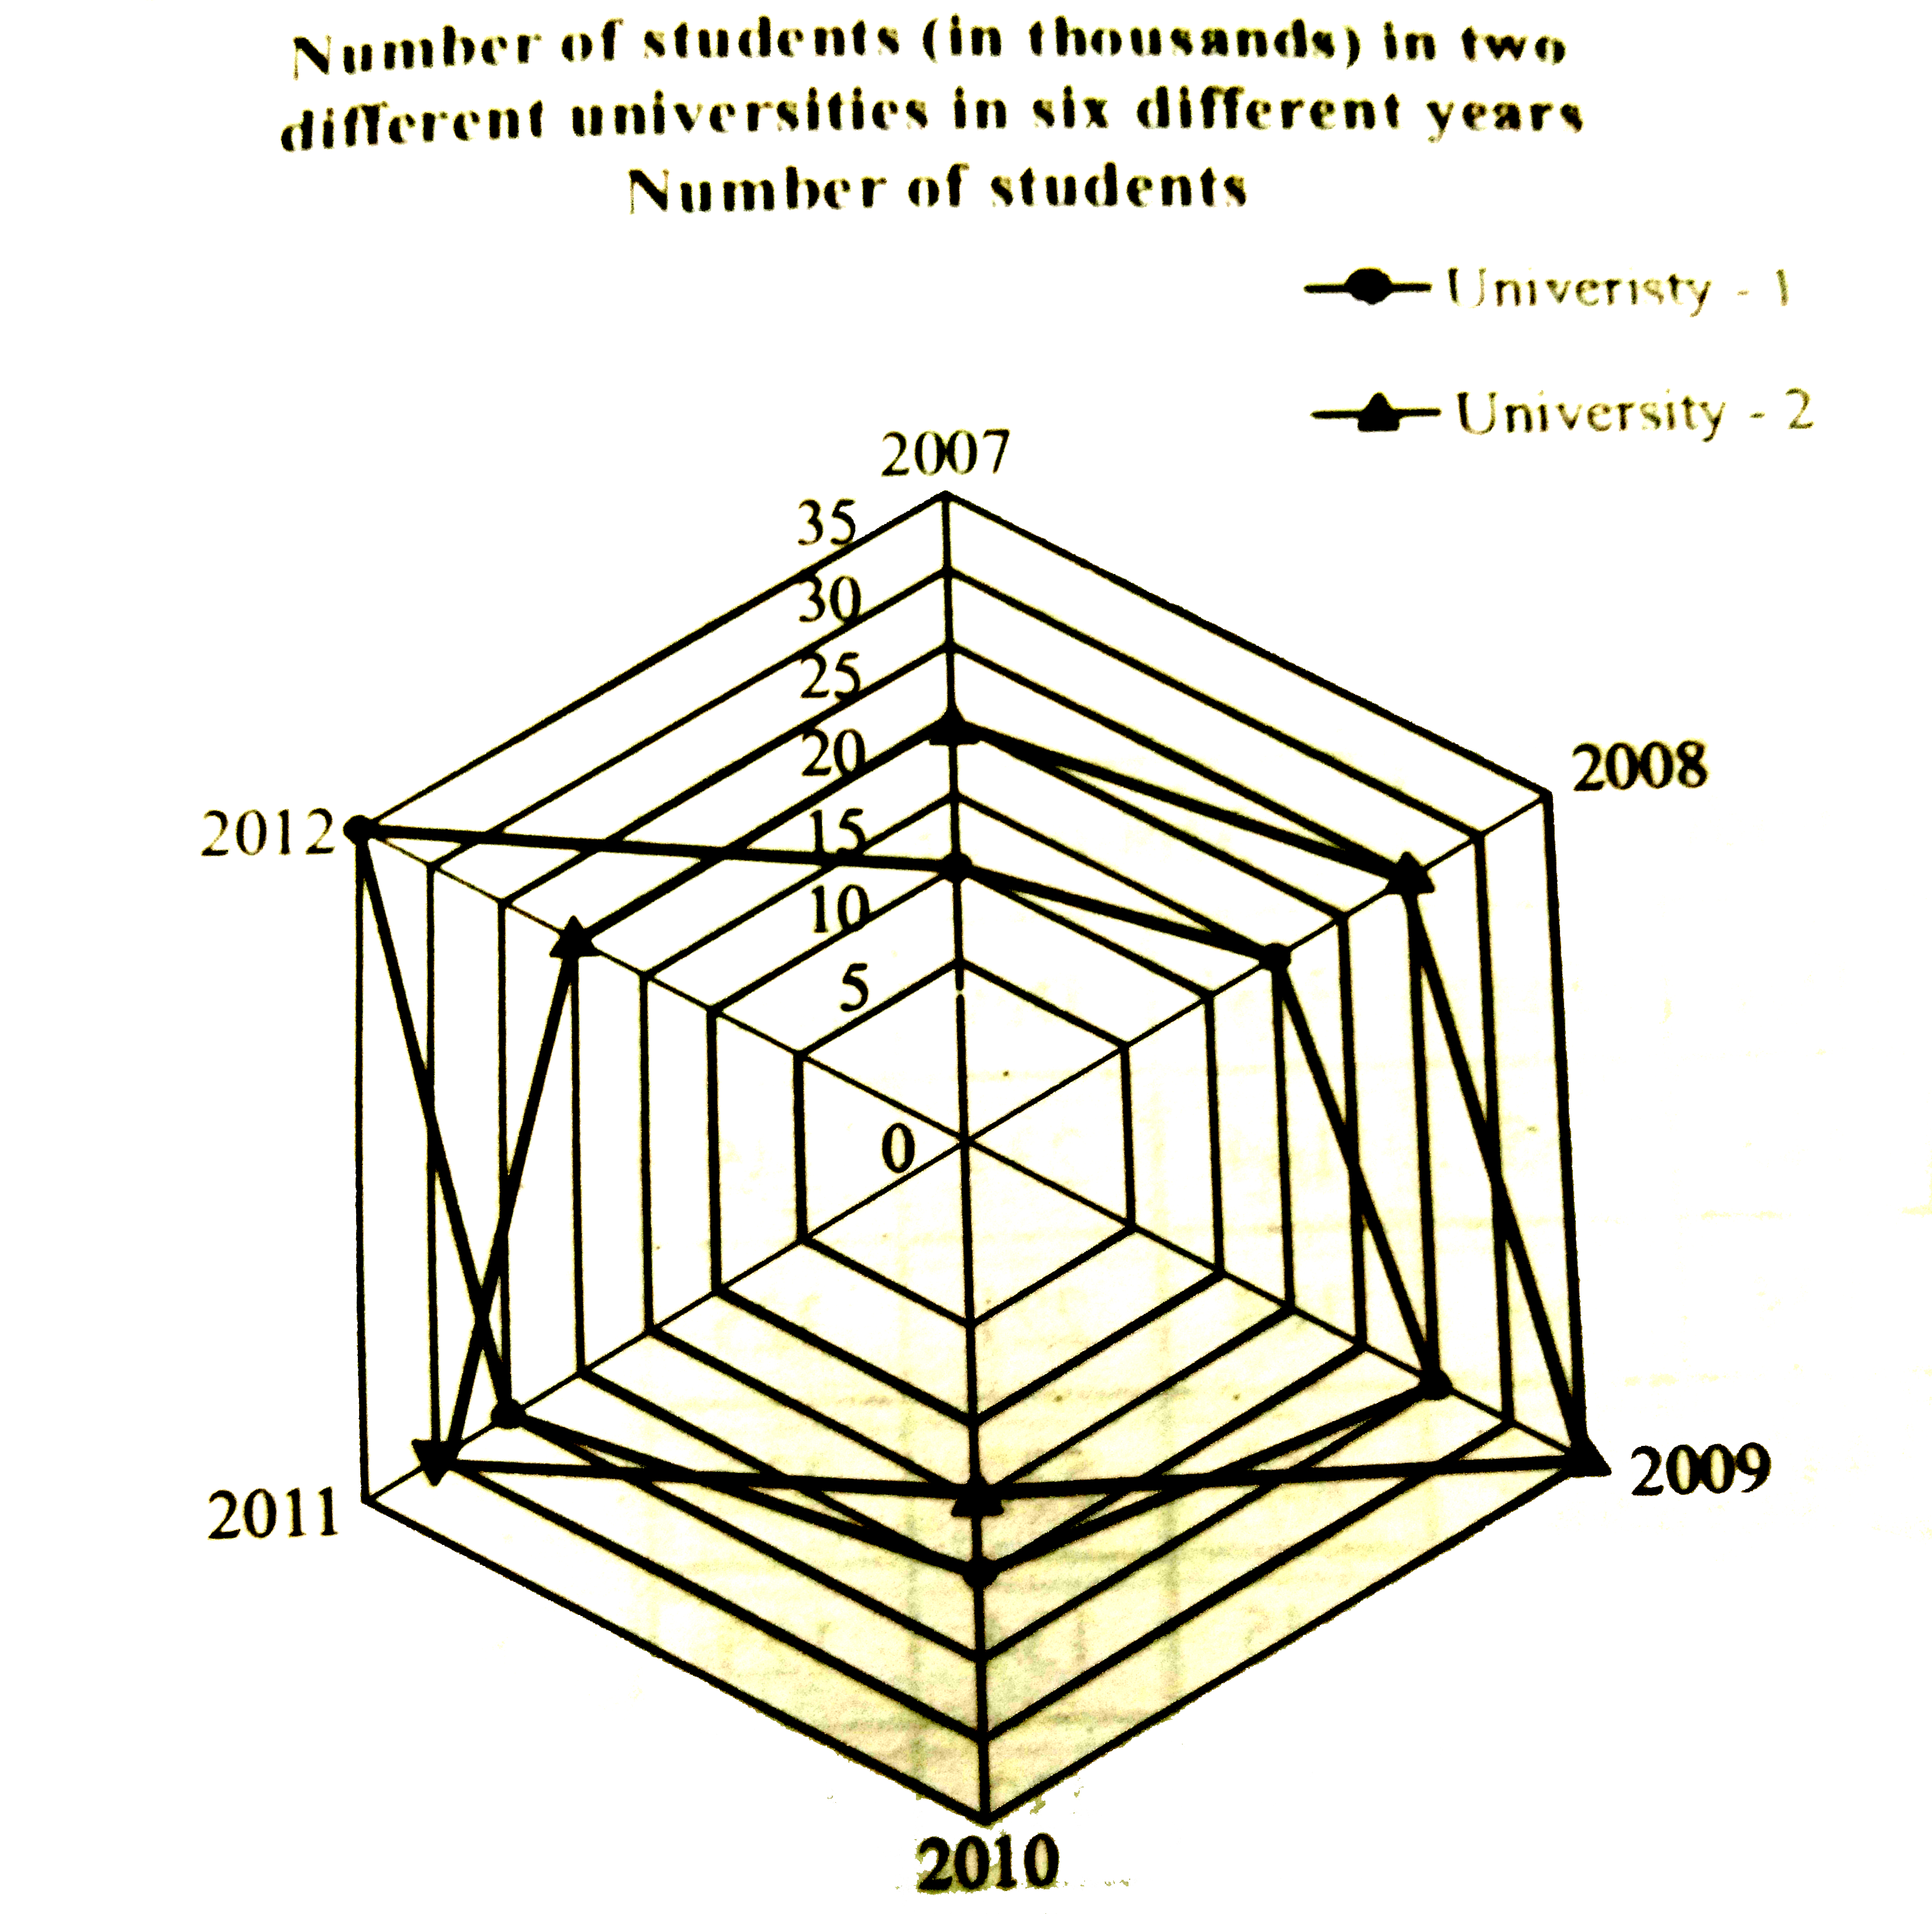
If 25% of the studetns in university-2 in the year 2010 were females, what was the number of male students in the university same year ?
View Solution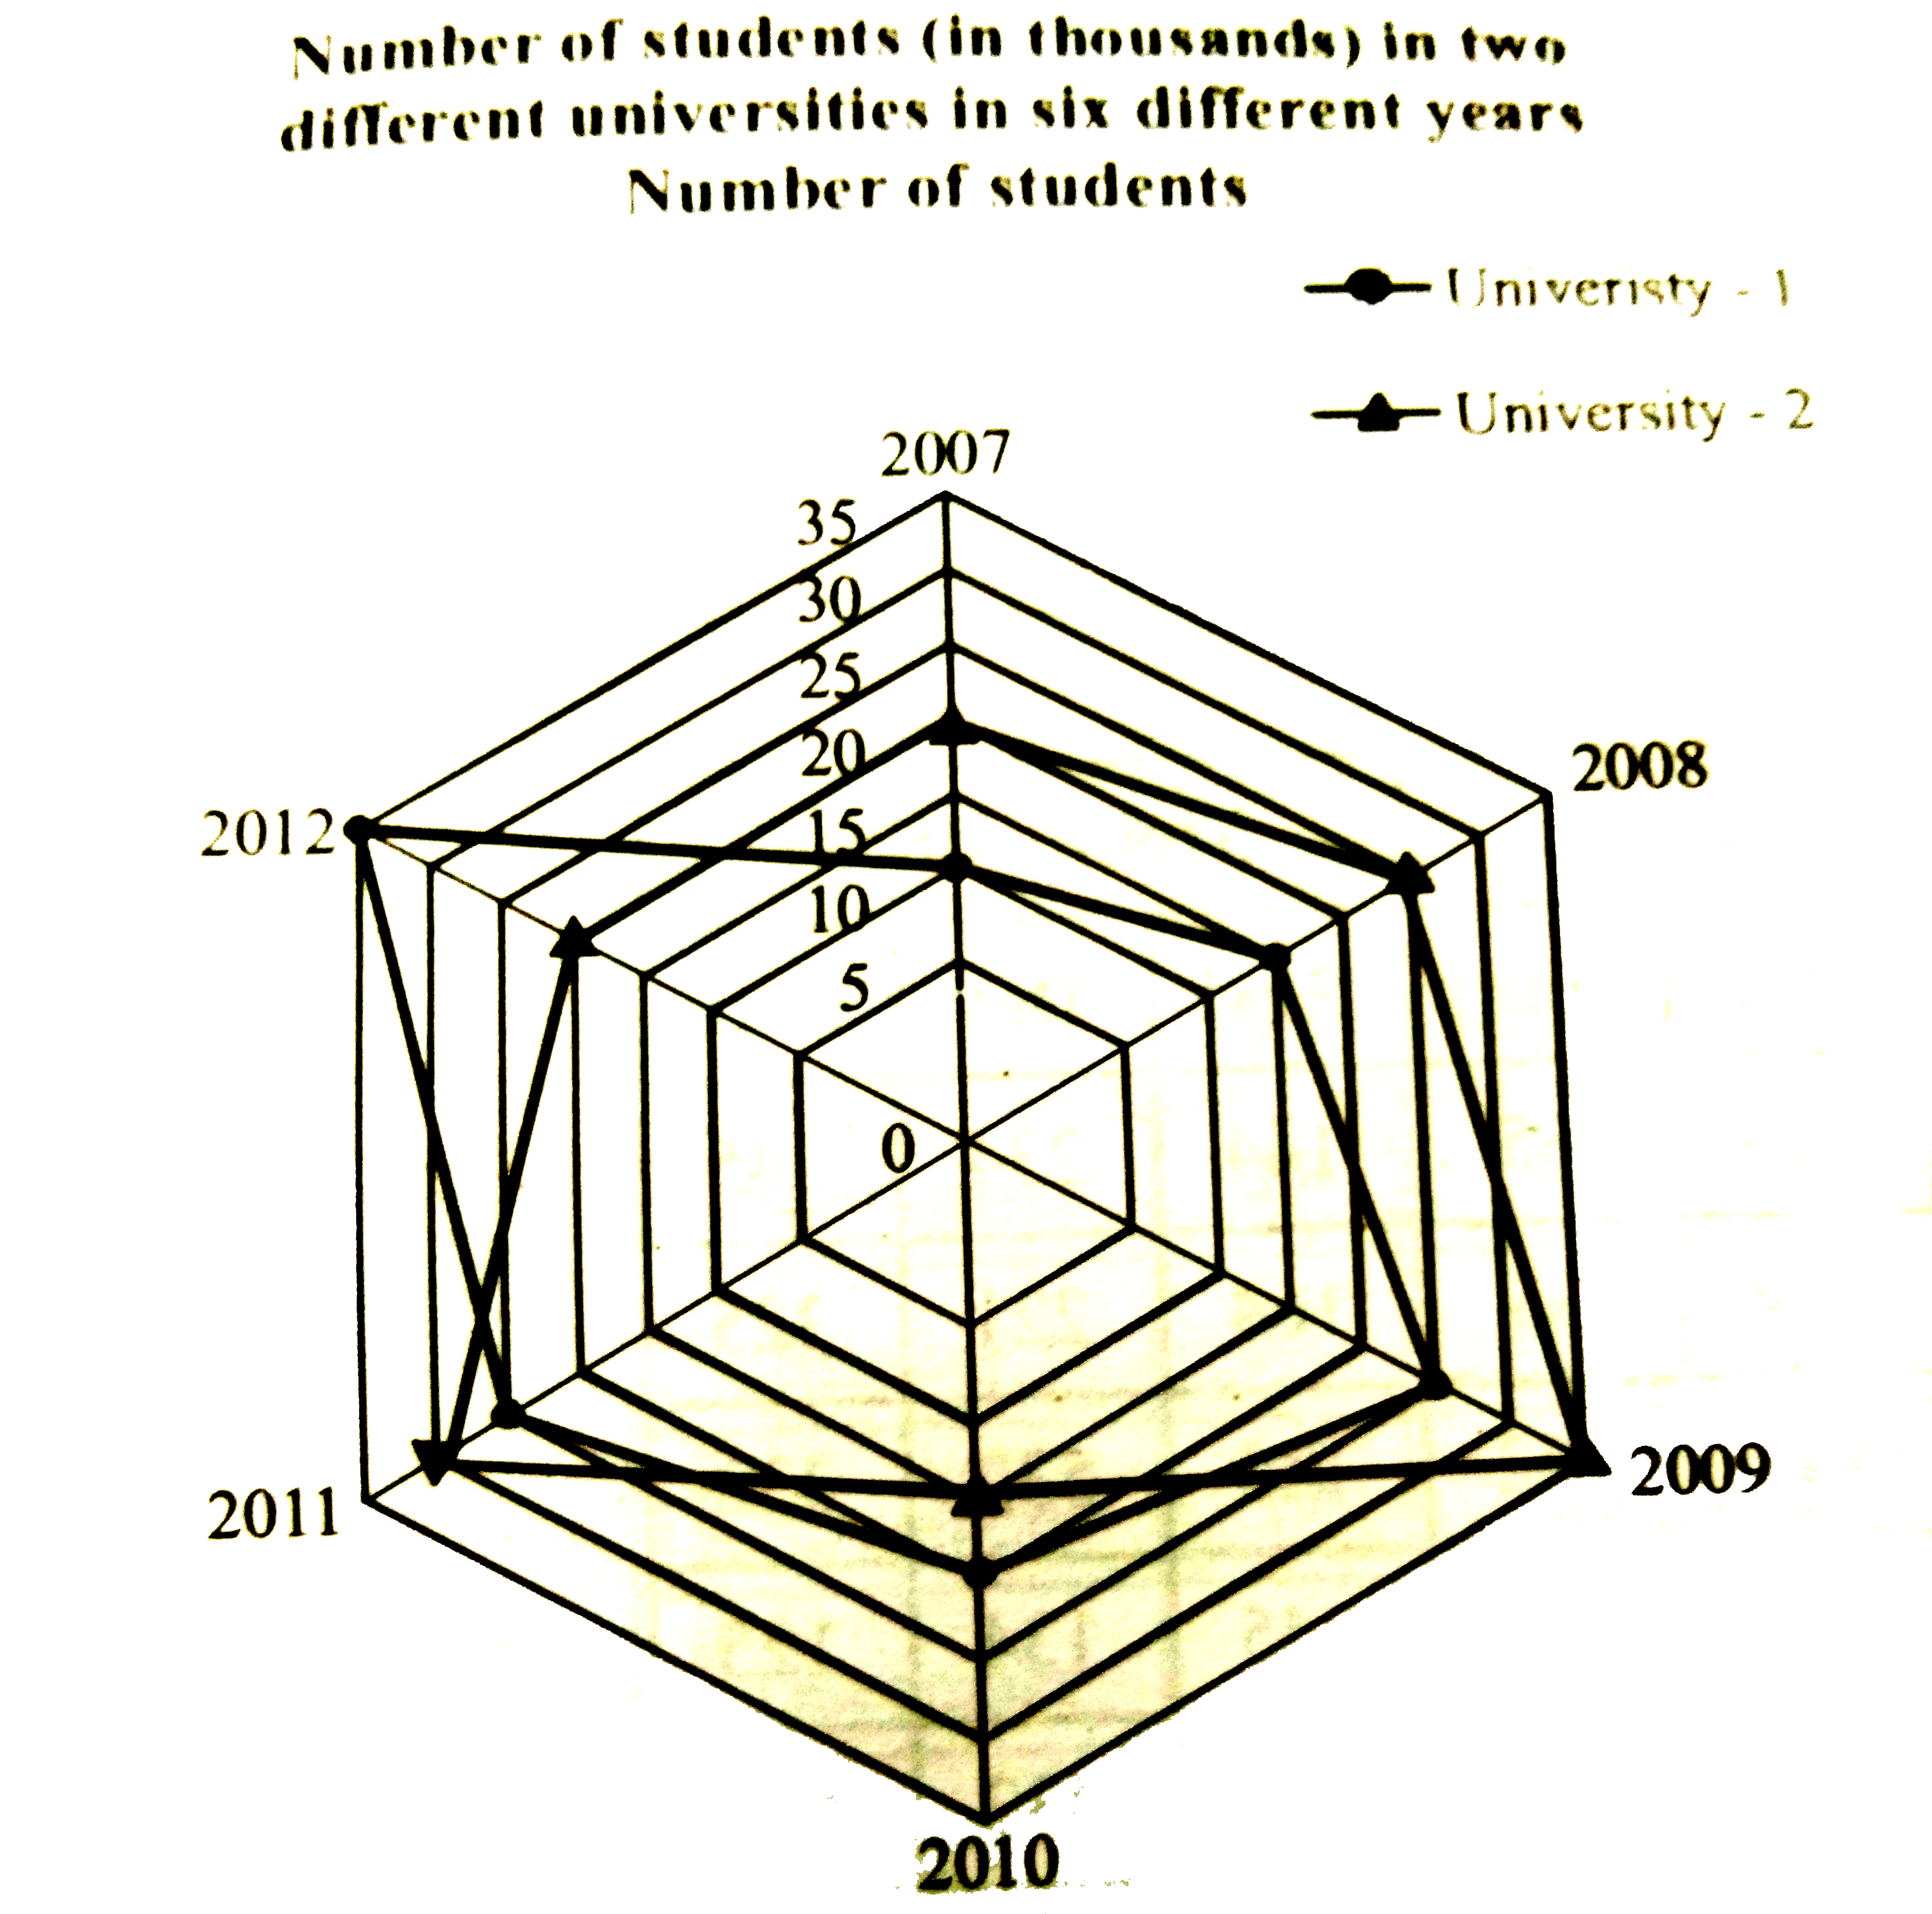
What is the sum of the number of students in university-1 in the year 2007 and the number of students in university-2 in the year 2011 together ?
View Solution
Knowledge Check
Directions (Q. Nos. 11-15) Study the radar graph carefully and answer the questions that follow.
Number of students (in thousand) in two
different universities in six different years.
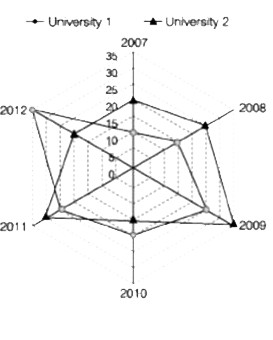
What was the difference between the number of students in University 1 in the year 2010 and the number of students in University 2 in the year 2012?A5000B15000C10000D1000Directions (Q. Nos. 11-15) Study the radar graph carefully and answer the questions that follow.
Number of students (in thousand) in two
different universities in six different years.
What is the sum of the number of students in University 1 in the year 2007 and the number of students in University 2 in the year 2011 together?A50000B55000C45000D40000Directions (Q. Nos. 11-15) Study the radar graph carefully and answer the questions that follow.
Number of students (in thousand) in two
different universities in six different years.
What was the per cent increase in the number of students in University 1 in the year 2011 as compared to the previous year?A135B15C115D25
What was the difference between the number of students in university-1 in the year 2010 and the number of students in university-2 in the year 2012 ?
View Solution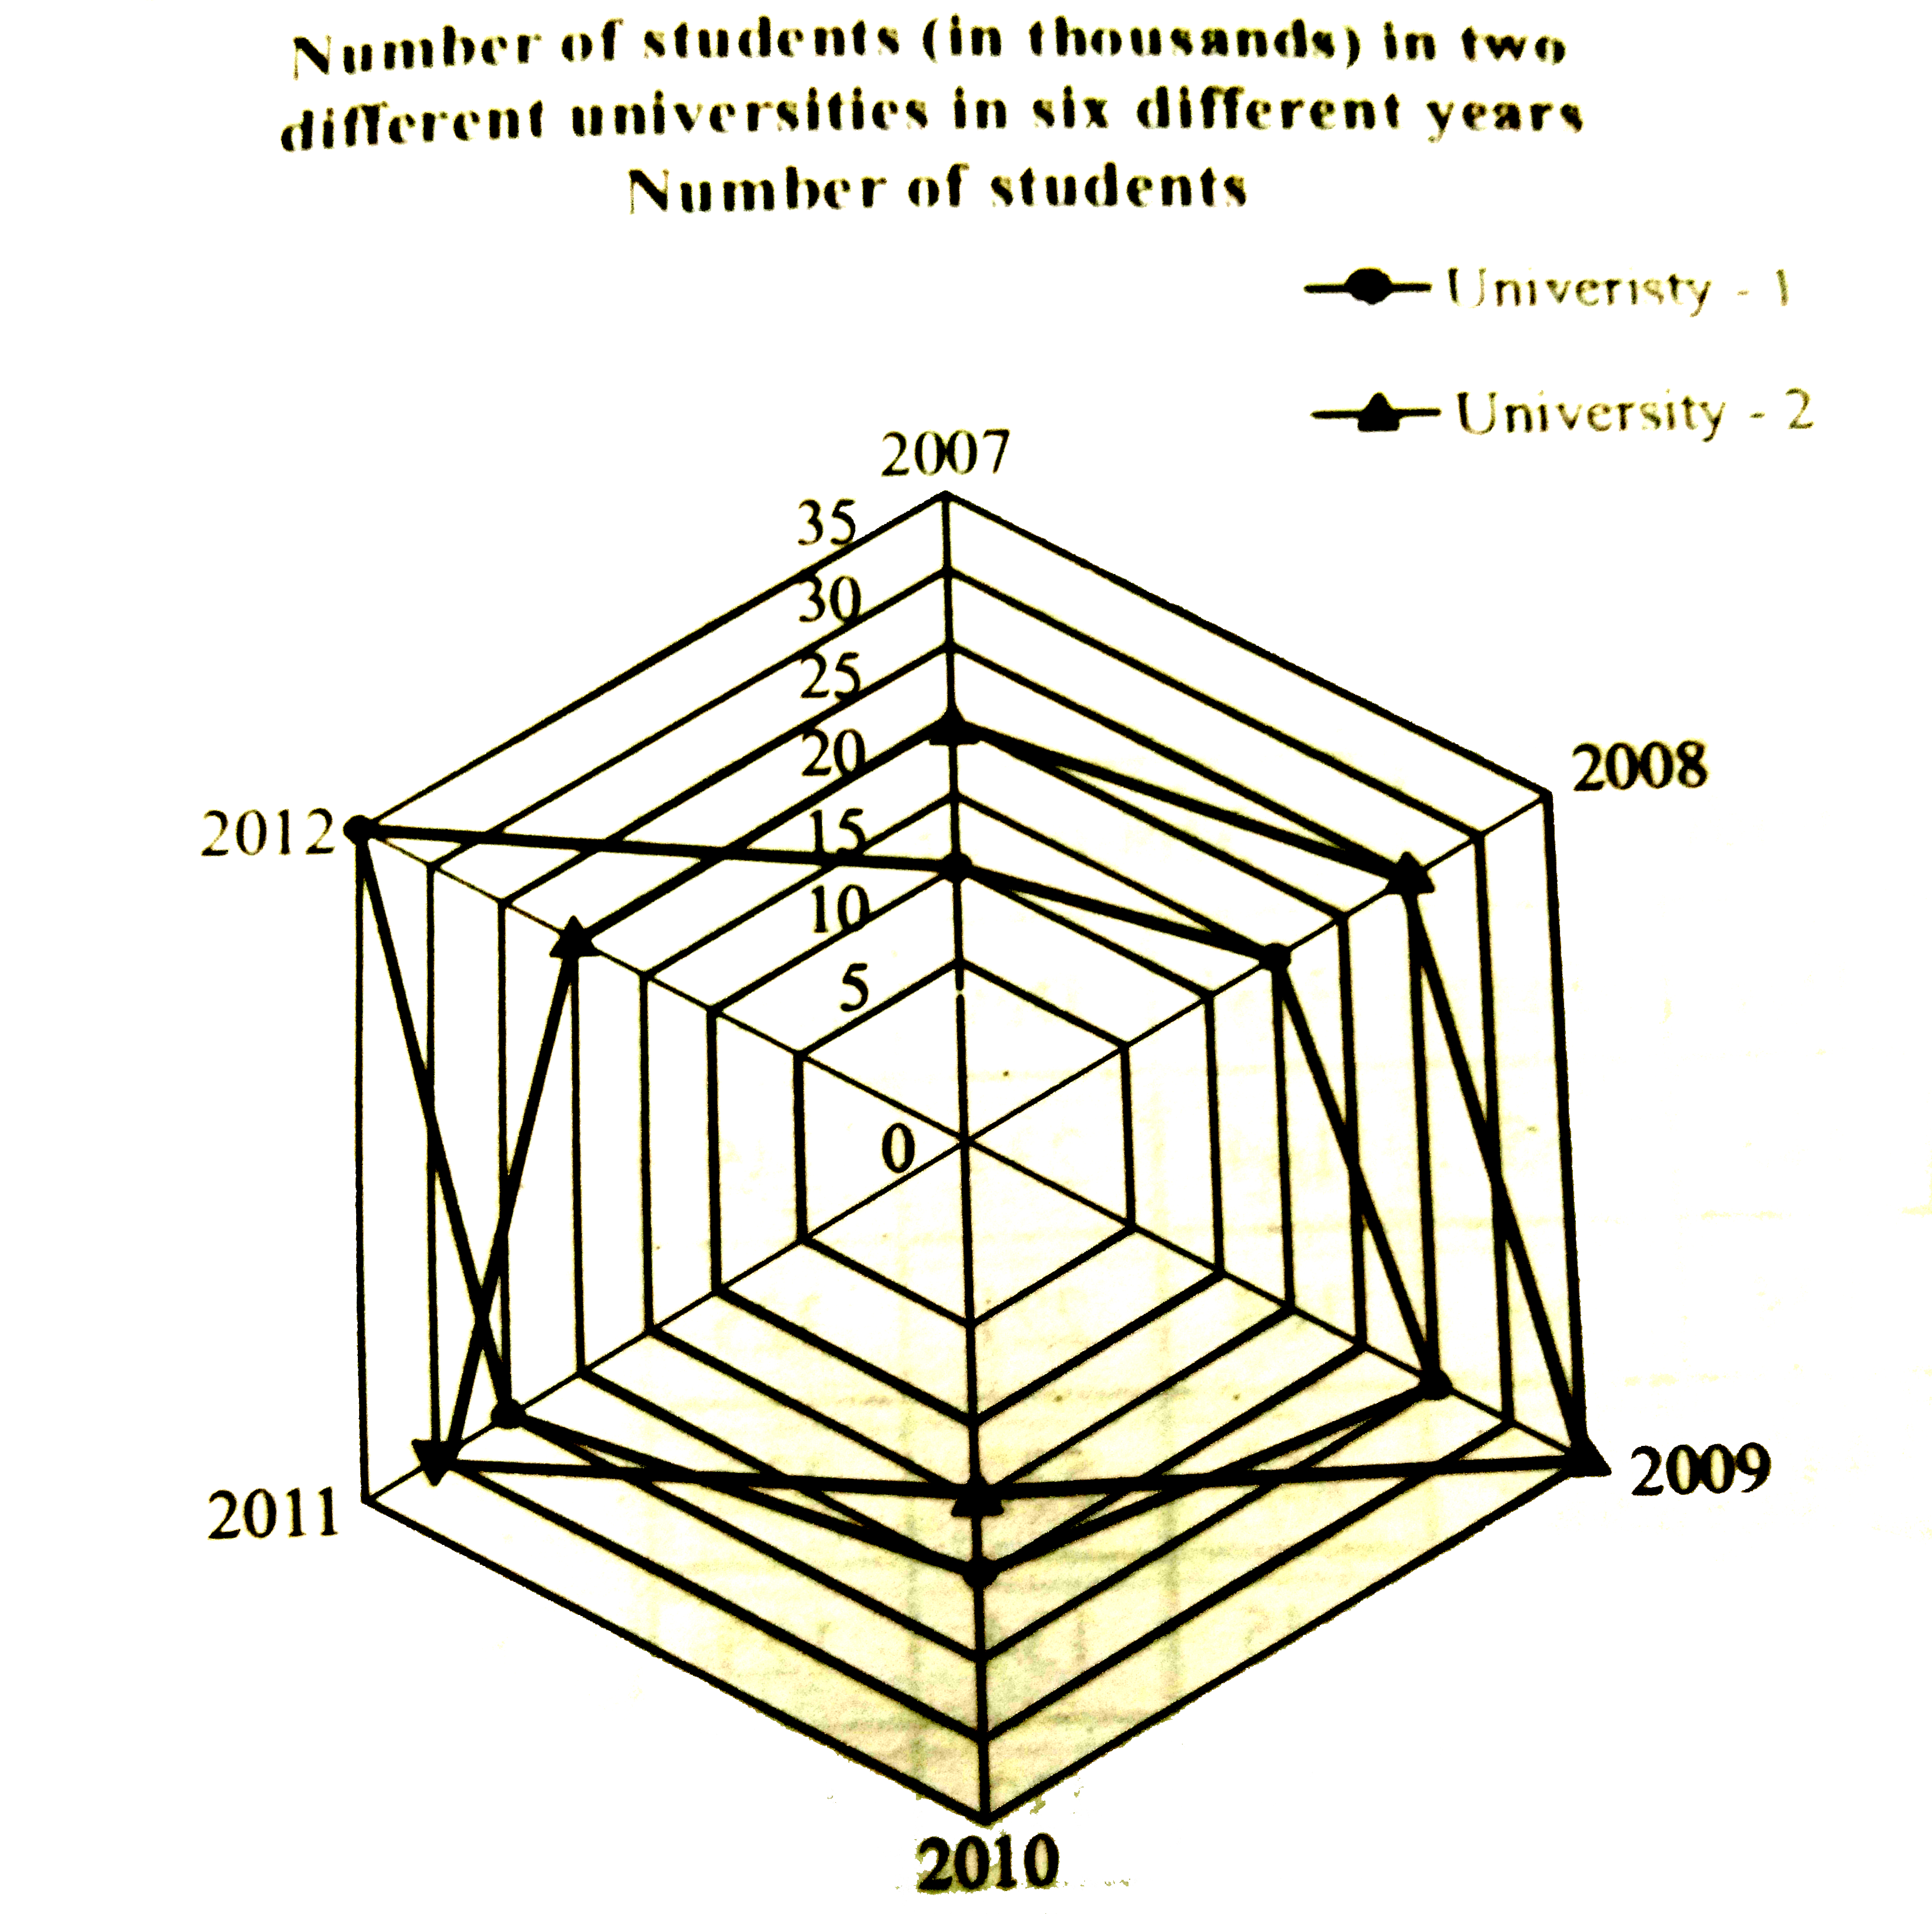
In which year was the difference between the number of students in university -I and the numer of students in university-2 highest?
View SolutionStudy the following graph carefully and answer the questions that follow
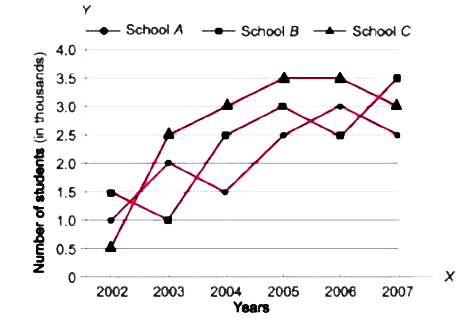
What was the average number of students in all schools together in the year 2006 ?
View SolutionStudy the following graph carefully and answer the questions given below :
Number of students studying in different University in a year (Number in lakhs)
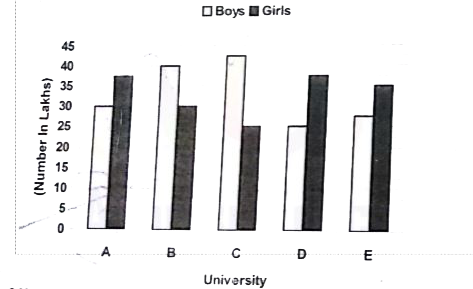
What is the average number of boys in all university together ?
View SolutionStudy the following graph carefully to answer the questions that follow-----
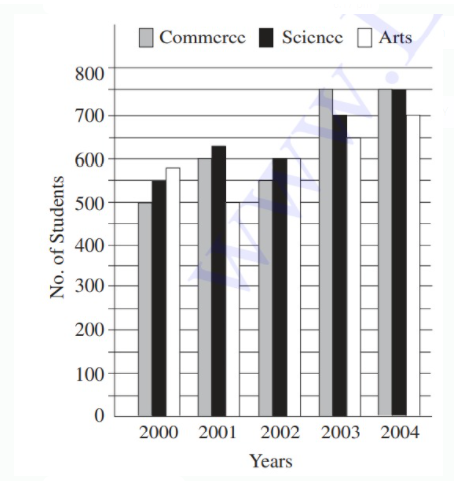
What is the total number of students studying Arts in all the years together ?
View Solution
