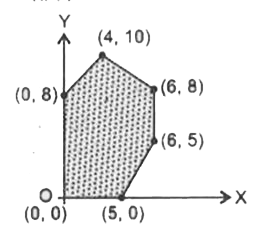
संलग्न आकृति में किसी LPP का सुसंगत हल प्रदर्शित है।माना
Z
=
3
x
−
4
y
उद्देश्य फलन है।
 ।
।
Z का अधिकतम मान किस बिन्दु पर है?
The correct Answer is:a
Step by step video, text & image solution for संलग्न आकृति में किसी LPP का सुसंगत हल प्रदर्शित है।माना Z = 3 x − 4 y उद्देश्य फलन है। । Z का अधिकतम मान किस बिन्दु पर है? by Maths experts to help you in doubts & scoring excellent marks in Class 12 exams.
Topper's Solved these Questions
- BOOK - UP BOARD PREVIOUS YEARCHAPTER - रैखिक प्रोग्रामन EXERCISE - अतिलघु उत्तरीय प्रश्नोत्तर6videos
रैखिक प्रोग्रामन
- BOOK - UP BOARD PREVIOUS YEARCHAPTER - रैखिक प्रोग्रामन EXERCISE - लघु उत्तरीय प्रश्नोत्तर8videos
रैखिक प्रोग्रामन
- BOOK - UP BOARD PREVIOUS YEARCHAPTER - रैखिक प्रोग्रामन EXERCISE - दीर्घ उत्तरीय प्रश्न22videos
रैखिक प्रोग्रामन
- BOOK - UP BOARD PREVIOUS YEARCHAPTER - मॉडल प्रश्न-पत्र-5EXERCISE - प्रश्न36videos
मॉडल प्रश्न-पत्र-5
- BOOK - UP BOARD PREVIOUS YEARCHAPTER - संबन्ध एवं फलन EXERCISE - विस्तृत उत्तरीय प्रश्नोत्तर7videos
संबन्ध एवं फलन
Similar Questions
किसी LPP में, वह रैखिक फलन, जिसका अधिकतमीकरण या न्यूनतमीकरण करना होता है, क्या कहलाता है?
01:37View Solutionनिम्नलिखित व्यवरोधों के अंतर्गत Z=x2+y2 का अधिकतमीकरण कीजिए :
x+y≤5, x≥0, y≥006:07View Solutionरैखिक प्रोग्रामन समस्या का निम्न अवरोधों के अंतर्गत x+y≤4,x≤0,y≤0 का हल ग्राफीय विधि द्वारा दर्शाया !
02:11View Solutionसही विकल्प चुनकर अपनी उत्तर पुस्तिका में लिखिए---
समुच्चय (x,y) में द्विआधारी-संक्रियाओं की संख्या है-01:31View Solutionयदि R और S समुच्ये X में तुल्यता सम्बन्ध हो, तो सिद्ध कीजिए कि R∪S,R∩S, भी X में तुल्यता सम्बन्ध है
02:45View SolutionHow many lines of symmetry does the above figure have ?
02:17View SolutionWhich of the following are correct chain isomers of butane ? (i)
05:41View SolutionDetermine the point of symmetry of a regular hexagon.
02:10View SolutionDtermine the images of the following figure about the given line :
02:17View SolutionMatch the following Column A to Column B
 02:10View Solution
Match the following Column A to Column B
 04:23View Solution
Match the following Column A to Column B
 01:13View Solution
The inequation represented by the graph given below is :
01:50View SolutionThe inequation that best describes the graph given below is _________
03:32View SolutionThe inequation that best describes the following graph is _________
04:01View SolutionWhich inequations represent the shaded region in the given figure
02:34View Solution

