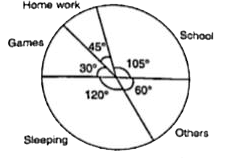
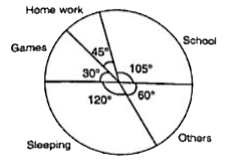
The following pie chart shows the hourly distribution of all the major activities of a student.
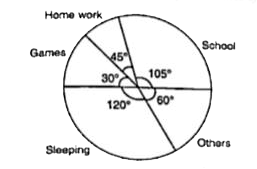
What is the difference in time (in hours) spends in school and in home work :
2
3
4
8
The correct Answer is:C
Step by step video, text & image solution for The following pie chart shows the hourly distribution of all the major activities of a student. What is the difference in time (in hours) spends in school and in home work : by Maths experts to help you in doubts & scoring excellent marks in Class 14 exams.
Updated on:21/07/2023Topper's Solved these Questions
- PERCENTAGESBOOK - ARIHANT SSCCHAPTER - PERCENTAGESEXERCISE - Exercise (Level - 2)
50 Videos
- PERCENTAGEBOOK - ARIHANT SSCCHAPTER - PERCENTAGEEXERCISE - Higher Skill Level Questions
27 Videos
- PERMUTATIONS & COMBINATIONS BOOK - ARIHANT SSCCHAPTER - PERMUTATIONS & COMBINATIONS EXERCISE - FINAL ROUND
38 Videos
Similar Questions
The following pie-chart shows the percentage-wise distribution of the number of students in five different schools P, Q, R, S and T. The total number of students in all five schools together is 8400.
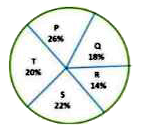
Find the average number of students in schools R and S together.
View SolutionFollowing pie chart shows the degree wise distribution of the students of a school using different transport while going to school. Read the chart answer the questions carefully.
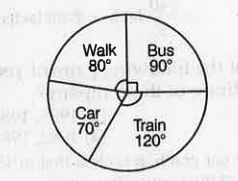
Total number of students = 2160
The number of students who come to school by car, is
View Solution
Knowledge Check
The following pie chart shows the hourly distribution of all the major activities of a student.
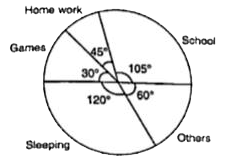
The percentage of time which he spends in school is :A38%B30%C40%D25%The following pie chart shows the hourly distribution of all the major activities of a student.
How much time (in per cent) he spends in games in comparison to sleeping ?A30%B40%C25%Dnone of theseThe following pie chart shows the hourly distribution of all the major activities of a student.
If he spends the time in games equal to the home work and remains constant in other activities, then the percentage decrease in time of sleeping :A0.15B12.5%C20%Dnone of these
Following pie chart shows the degree wise distribution of the students of a school using different transport while going to school. Read the chart answer the questions carefully.
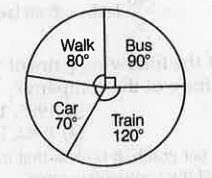
Total number of students = 2160
Find the ratio of number of students who come to school by bus and that of by car.
View SolutionThe following pie chart shows the hourly distribution of all the major activities of a student.
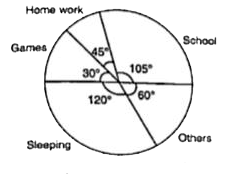
If he spends 13 rd time of home work in Mathematics then the no. of hours spends in rest of the subjects in home work :
View SolutionThe pie chart given below shows the number of students in 5 sections .The number of students is 7200.
What is the difference between the number of students in section C and section D?
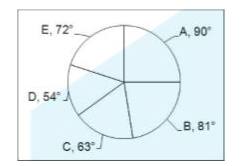
View SolutionThe pie chart given below shows the distribution of students who like the given 5 sports. The total number of students is 960.
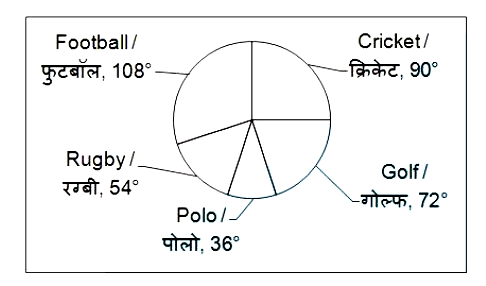
What is the difference between the number of students who like Cricket and those who like Golf?
View SolutionThe following pie-chart shows the study-time of different subjects of a student in a day. Study the pie-chart and answer the following questions
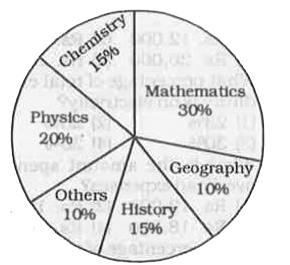
Instead of 10%, if the student spends 15% of study other subjects and the time is taken from the time scheduled to study mathematics and if he / she used to study 20 hours per day, then the difference of time for studying mathematics per day is :
View Solution
