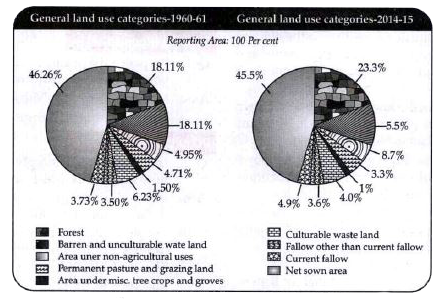
Why has the land under forests not increased much from 1960 - 61?
(i) Land resources in India are primarily divide into agricultural land, forest land, land meant for pasture and grazing land for other non-agricultural use and waste land. Waste land includes rocky, arid and desert areas. Land is also used for other non-agricultural purpose such as housing, roads and industry. According to the data for 2002-03, about 54% of the total land area is cultivable or follow, 22.5% is covered by forests and 3.5% is used for grazing. The rest is waste land, with traces of miscellaneous cultivation. The improper use of forest land has degraded the available land area and has made conservation of forests difficult. Human activities such as deforestation, mining and quarrying have contributed to the slow growth rate of forests. Thus, land under forest has increased by only about 4% since 1960-61. (ii) (a) Technological development has led to industrialization which has increased the use of natural resources. (b) Technological development has converted the subsistence agriculture to commercial agriculture and this has led to the over utilization of soil. (c) The development of technology contributed to increased production of quality goods and provision of better services to the people. (d) Technological development has also improved the process of mining. (e)Economic development has led to increasing urbanization and modernization which demands more resources.
Topper's Solved these Questions
- BOOK - X BOARDSCHAPTER - SOCIAL SCIENCE 2016 EXERCISE - TERM II (OUTSIDE DELHI SET - I)31videos
SOCIAL SCIENCE 2016
- BOOK - X BOARDSCHAPTER - SOCIAL SCIENCE 2016 EXERCISE - TERM II (OUTSIDE DELHI SET - II)10videos
SOCIAL SCIENCE 2016
- BOOK - X BOARDSCHAPTER - SOCIAL SCIENCE 2015-16 (OUTSIDE DELHI)EXERCISE - QUESTIONS27videos
SOCIAL SCIENCE 2015-16 (OUTSIDE DELHI)
- BOOK - X BOARDSCHAPTER - SOCIAL SCIENCE 2016-17 (OUTSIDE DELHI)EXERCISE - QUESTIONS32videos
SOCIAL SCIENCE 2016-17 (OUTSIDE DELHI)
Similar Questions
Knowledge Check
- Question 1 - Select One
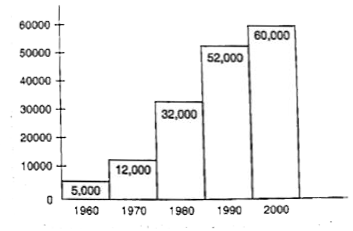
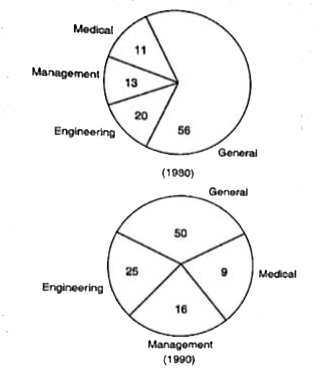
Number of different colleges in India in different years is given in the graph below. Distribution of different colleges in the years 1980 and 1990 shown in the pie charts below :


What is percentage increase in the number of colleges from 1960 to 1990 ?A1000%B940%C1040%D470%
Explain land use pattern in India and why has the land forest not increased much since 1960·1961.
View SolutionTry to do a comparison between the two pie charts (Fig 1.4) given for land use and find out why the net sown area and the land under forests have changed very marginally from 1960-61 to 2014-15
 View Solution
Why had their land not yielded much?
View SolutionHow much land should be under forests in country ?
View SolutionWhy a truck or a motor but has much wider tyres?
View SolutionWhen the load on a wire is increases from 0.61mm to 1.02mm. How much work is done during the extension of the wire ?
View SolutionAnswer the following questions briefly:
Briefly enumerate the changes in the land use pattern in India during 1960-61.View Solution

