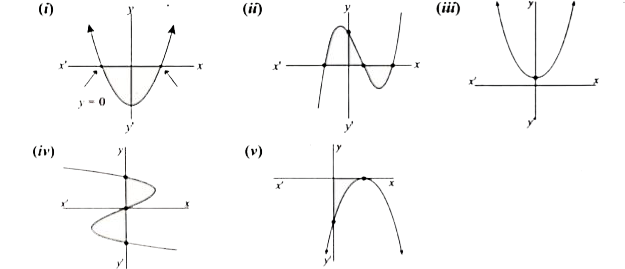
Find the number of zeros of the following polynomials represented by their graph ,
 Solution in Tamil
The correct Answer is:(i) Number of zeros =2
( ii) Number of zeros =3
(iii) Number of zeros =0
(iv) Number of zeros =1
Number of zeros =1
Step by step video, text & image solution for Find the number of zeros of the following polynomials represented by their graph , by Maths experts to help you in doubts & scoring excellent marks in Class 9 exams.
Topper's Solved these Questions
- BOOK - FULL MARKSCHAPTER - ALGEBRA EXERCISE - Exercise 3.312videos
ALGEBRA
- BOOK - FULL MARKSCHAPTER - ALGEBRA EXERCISE - Exercise 3.414videos
ALGEBRA
- BOOK - FULL MARKSCHAPTER - ALGEBRA EXERCISE - Exercise 3.112videos
ALGEBRA
- BOOK - FULL MARKSCHAPTER - COORDINATE GEOMETRYEXERCISE - TEXTBOOK ACTIVITY2videos
COORDINATE GEOMETRY
Similar Questions
Check whether p(x) is a multiple of g(x) or not.
p(x)=x3−5x2+4x−3,g(x)=x−206:07View SolutionExpand the following:
(i) (2x+3y+4z)2
(ii) (−p+2q+3r)2
(iii) (2p+3)(2p−4)(2p−5)
( iv) (3a+1)(3a−2)(3a+4)02:11View SolutionWhich of the following expression are polynomial .if not give reason :
(i) 1x2+3x−4
(ii) x2(x−1)
(iii) 1x(x+5)
(iv) 1x−2+1x−1+7
(v) √5x2+√3x+√2
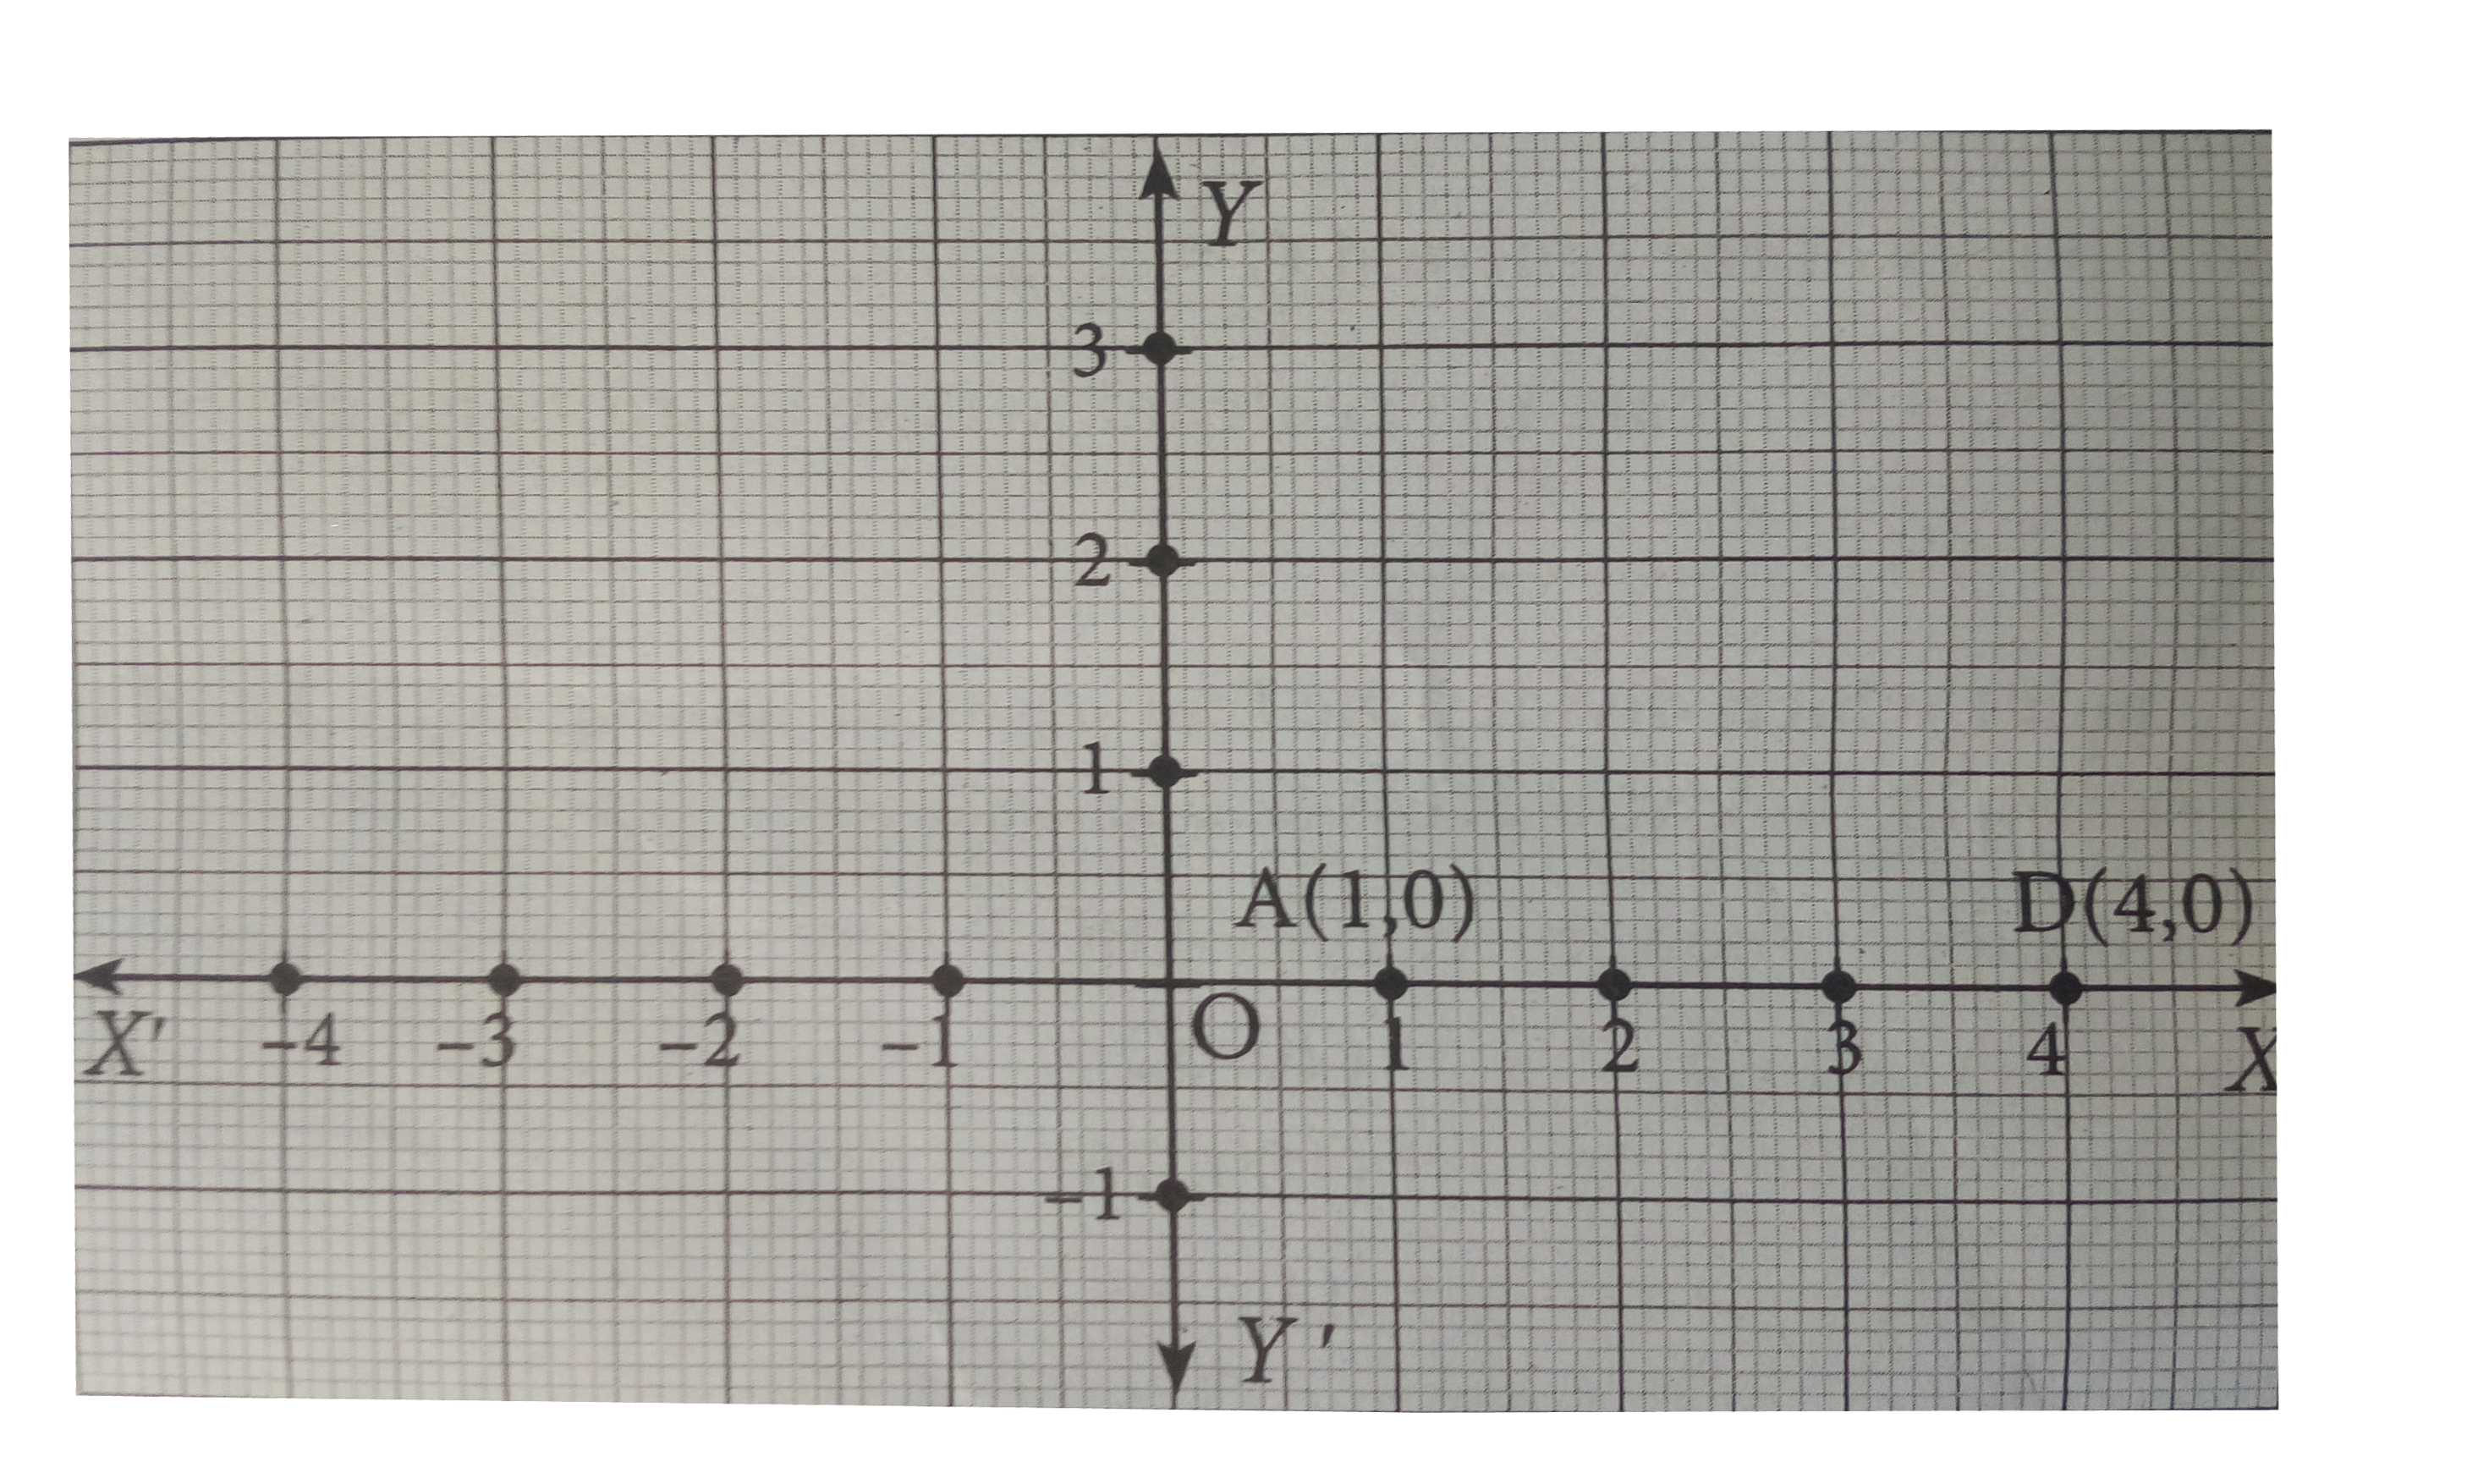
(vi ) m2−3√m+7m−1001:31View SolutionPlot the following points on a graph sheet by taking the scale as 1cm=1 unit.
Find how far the points are from each other?
A(1,0) and D(4,0). Find AD and also DA.
Is AD=DA?
You plot another set of points and verify your Result.
 02:45View Solution
Which of the following are correct chain isomers of butane ? (i)
02:17View SolutionDetermine the point of symmetry of a regular hexagon.
05:41View SolutionDtermine the images of the following figure about the given line :
03:28View SolutionMatch the following Column A to Column B
 02:21View Solution
Match the following Column A to Column B
 02:10View Solution
Match the following Column A to Column B
 02:17View Solution
Find the area of figure given below.
 02:10View Solution
Find the area of the figure given below.
 04:23View Solution
The inequation represented by the graph given below is :
01:13View SolutionThe inequation that best describes the graph given below is _________
01:32View SolutionThe inequation that best describes the following graph is _________
04:05View SolutionWhich inequations represent the shaded region in the given figure
03:10View Solution

