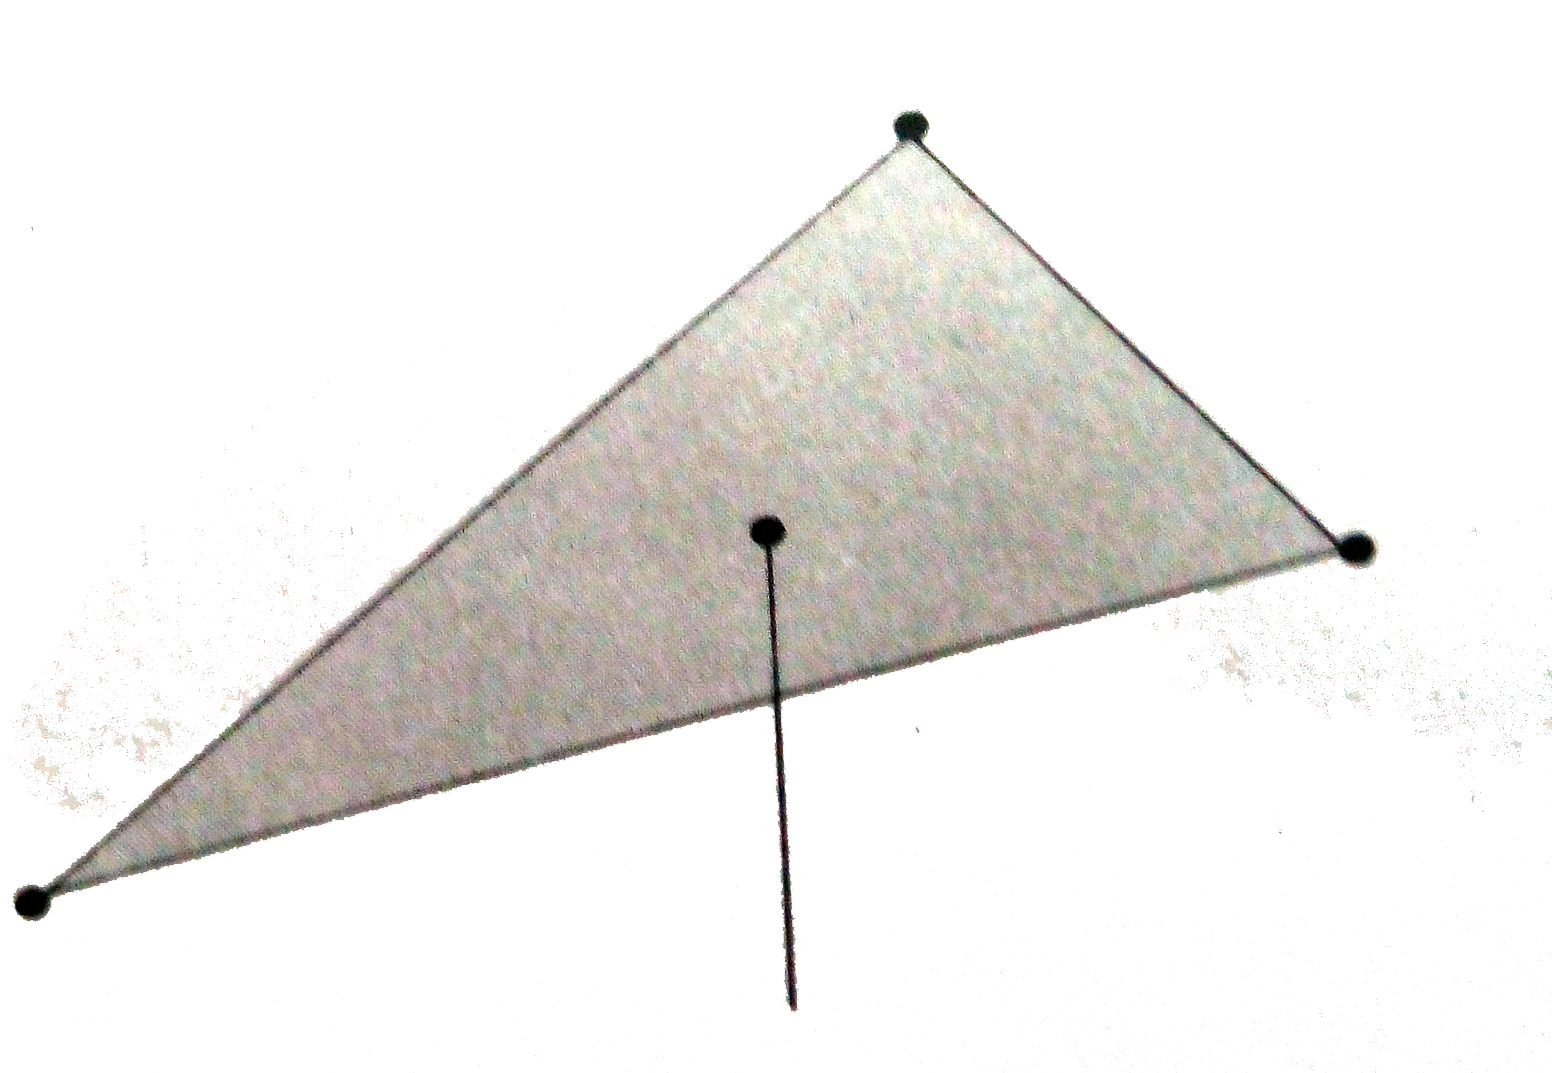
Master gave a traiangular plate with vertices A(5,8),B(2,4)C(8,3) and a stick to a student. He wants to balance the plate on the stick. Can you help the boy to locate theat point which can balance the plate.
 Solution in Tamil
Step by step video & image solution for Master gave a traiangular plate with vertices A(5,8),B(2,4) C(8,3) and a stick to a student. He wants to balance the plate on the stick. Can you help the boy to locate theat point which can balance the plate. by Maths experts to help you in doubts & scoring excellent marks in Class 9 exams.
Updated on:21/07/2023Topper's Solved these Questions
- COORDINATE GEOMETRYBOOK - FULL MARKSCHAPTER - COORDINATE GEOMETRYEXERCISE - EXERCISE -5.1
4 Videos
- COORDINATE GEOMETRYBOOK - FULL MARKSCHAPTER - COORDINATE GEOMETRYEXERCISE - EXERCISE -5.2
12 Videos
- ALGEBRA BOOK - FULL MARKSCHAPTER - ALGEBRA EXERCISE - Assignment Answer the following questions :
1 Videos
- GEOMETRYBOOK - FULL MARKSCHAPTER - GEOMETRYEXERCISE - Assignment (IV. Answer the following questions)
9 Videos
Similar Questions
Plot the following points in the coordinate system and identify the quadrants P(−7,6),Q(7,−2),R(−6,−7)S(3,5)andT(3,9).
View SolutionFind the distance between the following pairs of points. (i) (1,2) and (4,3)
View SolutionSubtract 5x2−4y2+6y−3 from 7x2−4xy+5y2+5x−3y
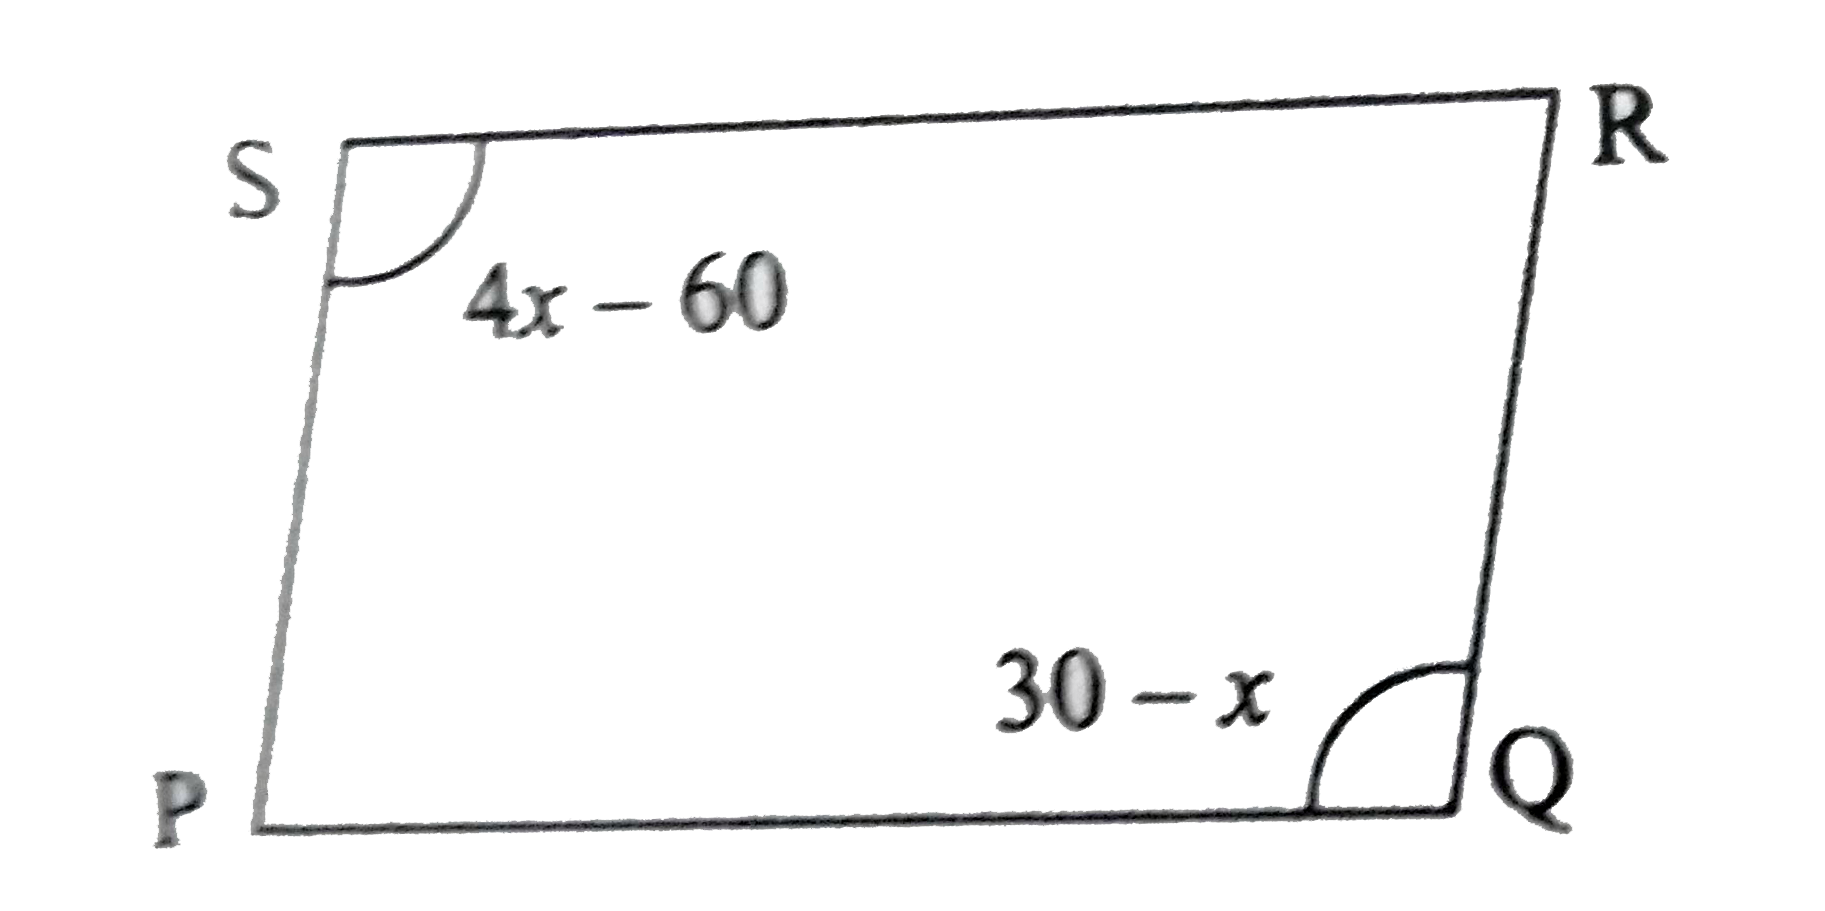
View SolutionIn the given diagram PQRS is a parellelogram.
∠S=4x−60∠Q=30−x. Find the angles of P and R .

View SolutionHow many lines of symmetry does the above figure have ?
View SolutionWhich of the following are correct chain isomers of butane ? (i)
View SolutionDetermine the point of symmetry of a regular hexagon.
View SolutionDtermine the images of the following figure about the given line :
View SolutionMatch the following Column A to Column B

View SolutionMatch the following Column A to Column B

View SolutionMatch the following Column A to Column B

View SolutionThe inequation represented by the graph given below is :
View SolutionThe inequation that best describes the graph given below is _________
View SolutionThe inequation that best describes the following graph is _________
View SolutionWhich inequations represent the shaded region in the given figure
View Solution
