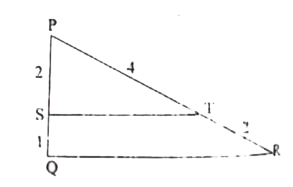
In the given diagram show that △PST~△PQR.
 . Solution in Tamil
Step by step video & image solution for In the given diagram show that triangle PST ~triangle PQR. . by Maths experts to help you in doubts & scoring excellent marks in Class 10 exams.
Updated on:21/07/2023Topper's Solved these Questions
- SAMPLE PAPER -4 BOOK - FULL MARKSCHAPTER - SAMPLE PAPER -4 EXERCISE - Part- III
14 Videos
- SAMPLE PAPER -4 BOOK - FULL MARKSCHAPTER - SAMPLE PAPER -4 EXERCISE - Part- IV
1 Videos
- SAMPLE PAPER -4 BOOK - FULL MARKSCHAPTER - SAMPLE PAPER -4 EXERCISE - Part- IV
1 Videos
- SAMPLE PAPER -3BOOK - FULL MARKSCHAPTER - SAMPLE PAPER -3EXERCISE - PART - III
16 Videos
- SAMPLE PAPER -5BOOK - FULL MARKSCHAPTER - SAMPLE PAPER -5EXERCISE - PART -IV
4 Videos
Similar Questions
Let A= The set of all natural numbers less than 8, B=The set of all prime numbers less than 8, C= The set of even prime number. Verify that
A×(B−C)=(A×B)−(AtimeC)
View SolutionDraw the graph of y=x2+3x+2 and use it to solve x2+2x+1=0.
View SolutionDraw the graph of y=x2+3x+2 and use it to solve x2+2x+1=0.
View SolutionFind x if g(f(f(x)))=f(g(g(x))),givenf(x)=3x+1andg(x)=x+3.
View SolutionDraw a circle of radius 4.5 cm. Take a point on the circle. Draw the tangent at that point using the alternate segment theorem.
View SolutionDetermine the point of symmetry of a regular hexagon.
View SolutionDtermine the images of the following figure about the given line :
View SolutionMatch the following Column A to Column B

View SolutionMatch the following Column A to Column B

View SolutionMatch the following Column A to Column B

View SolutionFind the area of the figure given below.

View SolutionCalculate the volume of the given solid.
ltimg src="https://d10lpgp6xz60nq.cloudfront.net/physics_images/PS_MATH_VII_C06_E03_002_Q01.png" width="80%"gt
View SolutionThe area of the shaded part in the figure given below is ______.

View SolutionThe inequation represented by the graph given below is :
View SolutionThe inequation that best describes the graph given below is _________
View SolutionThe inequation that best describes the following graph is _________
View Solution
