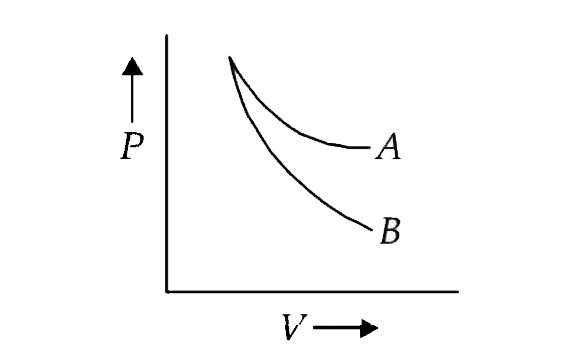
The curves A and B in the figure shown P-V graphs for an isothermal and an adiabatic process for an idea gas. The isothermal process is represented by the curve A.

Video Solution
Text Solution
The correct Answer is:1
|
Answer
Step by step video, text & image solution for The curves A and B in the figure shown P-V graphs for an isothermal and an adiabatic process for an idea gas. The isothermal process is represented by the curve A. by Physics experts to help you in doubts & scoring excellent marks in Class 12 exams.
Updated on:21/07/2023
Topper's Solved these Questions
- BOOK - FIITJEECHAPTER - HEAT AND TEMPERATUREEXERCISE - ASSIGNMENT PROBLEMS (SUBJECTIVE) (LEVEL II AND III)15videos
HEAT AND TEMPERATURE
- BOOK - FIITJEECHAPTER - HEAT AND TEMPERATUREEXERCISE - ASSIGNMENT PROBLEMS (OBJECTIVE) (LEVEL-I)50videos
HEAT AND TEMPERATURE
- BOOK - FIITJEECHAPTER - HEAT AND TEMPERATUREEXERCISE - ASSIGNMENT PROBLEMS (SUBJECTIVE) (level-1) (FILL IN THE BLANKS)5videos
HEAT AND TEMPERATURE
- BOOK - FIITJEECHAPTER - GRAVITATIONEXERCISE - Numerical based Question2videos
GRAVITATION
- BOOK - FIITJEECHAPTER - KINEMATICSEXERCISE - NUMERICAL BASED QUESTIONS DECIMAL TYPE5videos
KINEMATICS
Similar Questions
Knowledge Check
- Question 1 - Select One
For an ideal gas, in an isothermal process
AHeat content remains constantBHeat content and temperature remain constantCTemperature remains constantDNone of the above - Question 2 - Select One
In an isothermal process for an ideal gas
AΔQ=0BΔW=0CΔU=0DΔV=0 - Question 3 - Select One
In an isothermal process for an ideal gas
AΔQ=0BΔW=0CΔU=0DΔV=0
