The gas molecules randomly move in an directions and collide with each other and with the wall of the container. It is dificult to detemine the speed of an individual molecule but it has become possible to Work out the distribution of molecules among different molecular speeds. This is known as Maxwell
Boltzmann distribution.
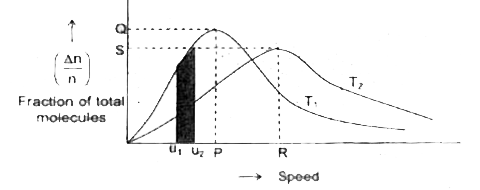
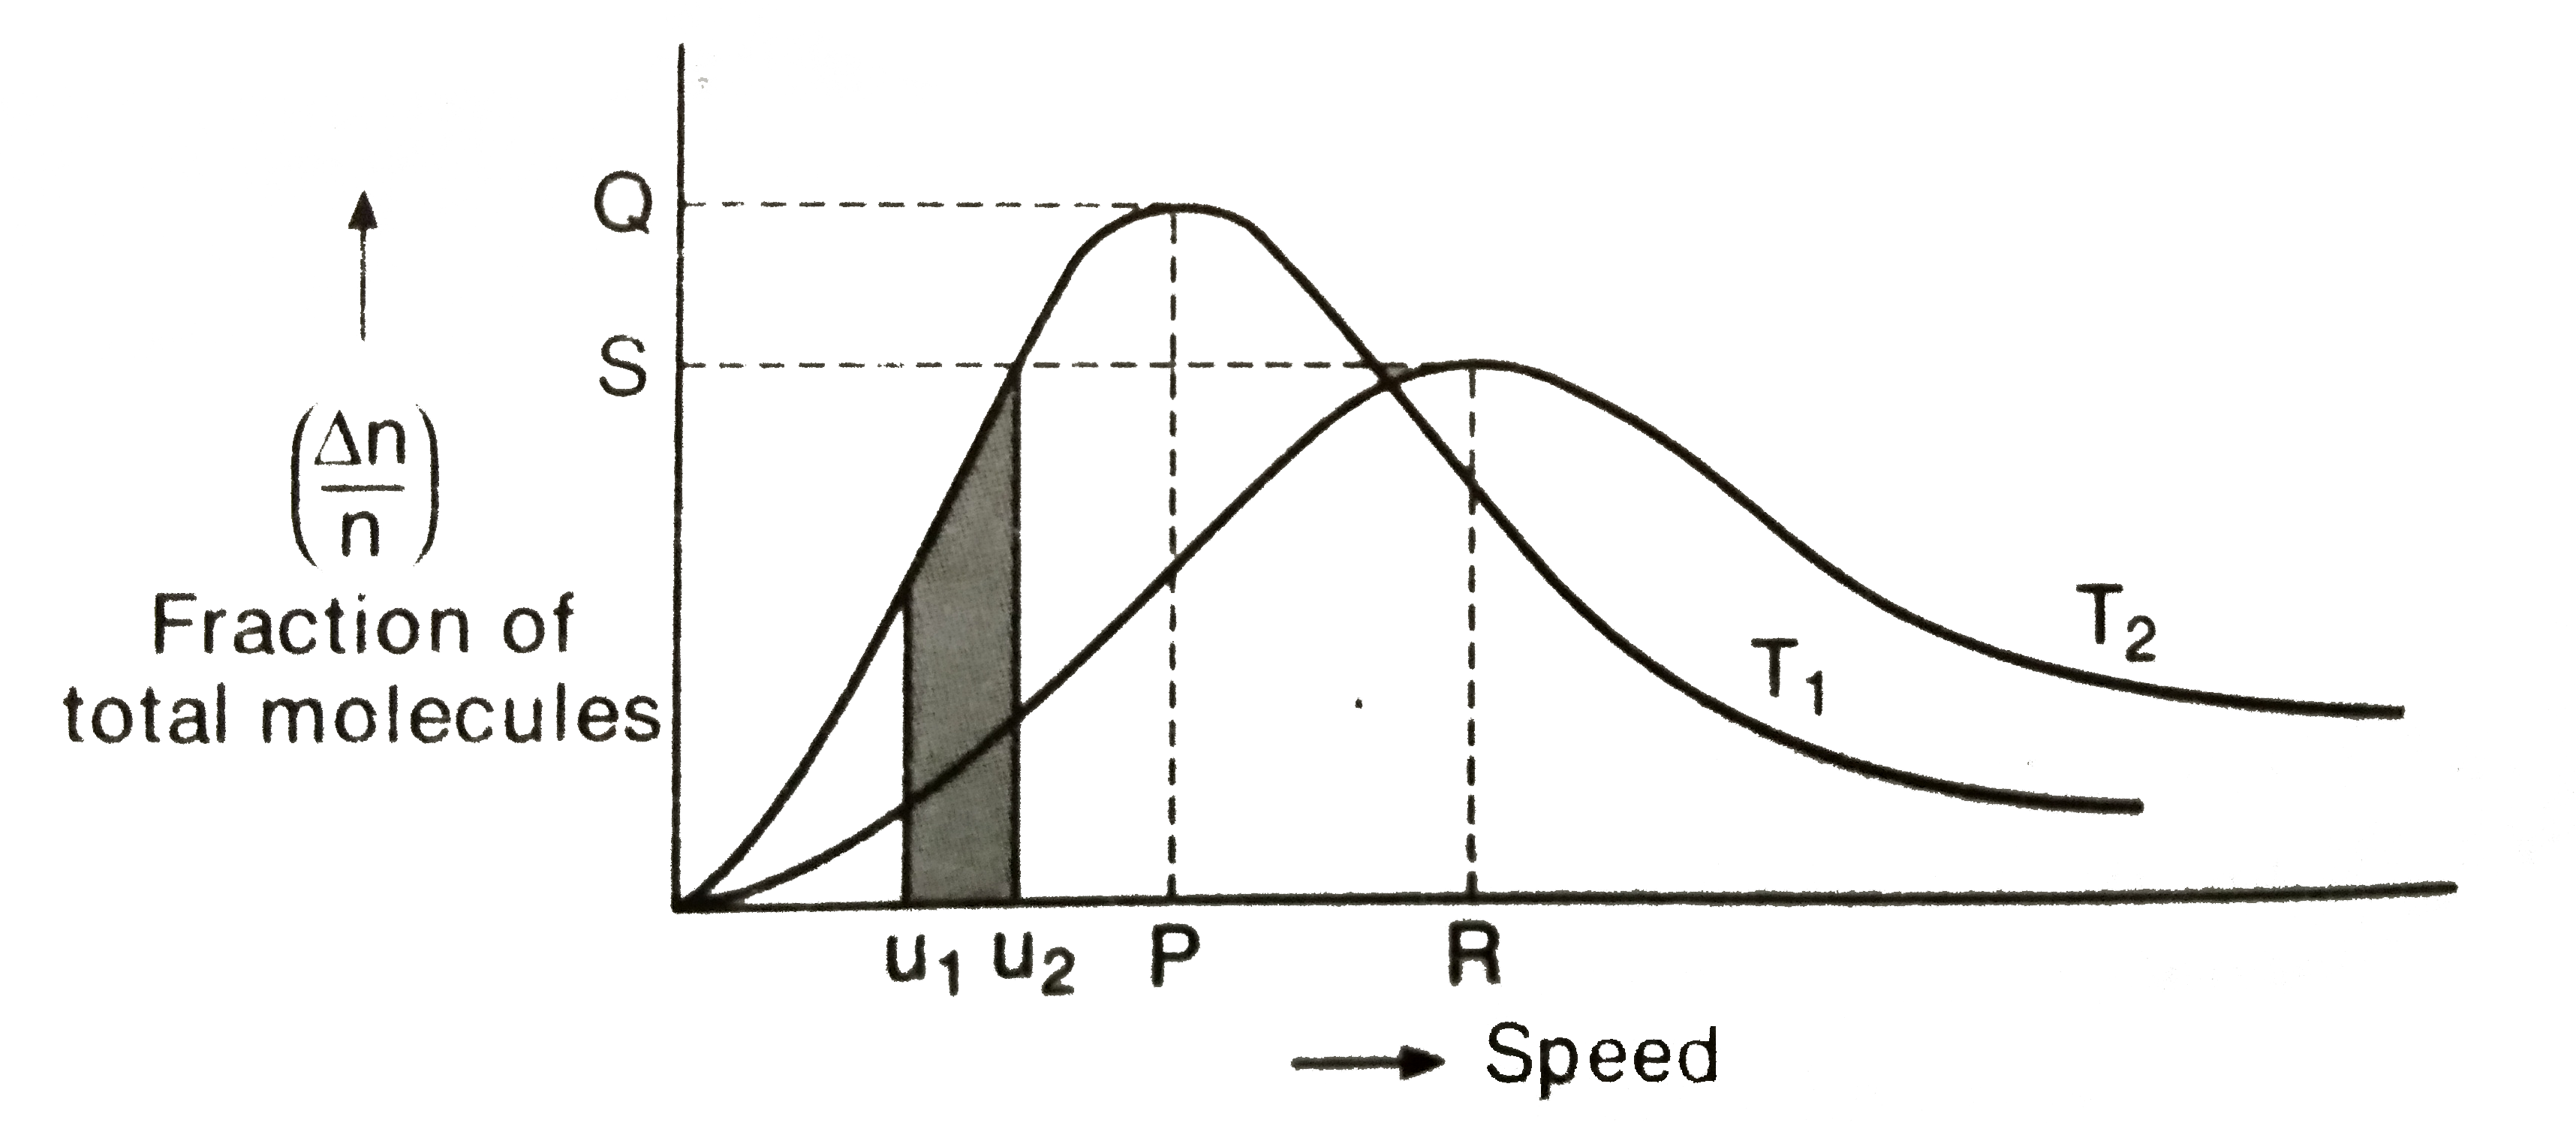
Consider the following graph about Maxwell's distribution of speeds at two different temperatures T1andT2 and answer the following questions:
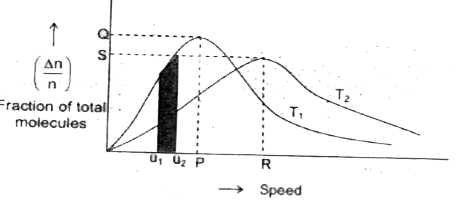
Total area under the curve at T1 is
equal to that under curve at T2
less than that under curve at T2
greater than that under curve at T2
can be greater or less than that under curve at T2m depending on the nature of the gas
The correct Answer is:A
Topper's Solved these Questions
- GASEOUS STATEBOOK - FIITJEECHAPTER - GASEOUS STATEEXERCISE - REASONING TYPE QUESTIONS
4 Videos
- GASEOUS STATEBOOK - FIITJEECHAPTER - GASEOUS STATEEXERCISE - MATCHING LIST TYPE QUESTION
1 Videos
- GASEOUS STATEBOOK - FIITJEECHAPTER - GASEOUS STATEEXERCISE - ASSIGNMENT PROBLEMS (OBJECTIVE) LEVEL-II COMPREHENSION-IV
5 Videos
- ENVIRONMENTAL CHEMISTRYBOOK - FIITJEECHAPTER - ENVIRONMENTAL CHEMISTRYEXERCISE - ASSIGNMENT PROBLEMS (OBJECTIVE) LEVEL -II (MULTIPLE CORRECT QUESTIONS)
20 Videos
- GENERAL ORGANIC CHEMISTRYBOOK - FIITJEECHAPTER - GENERAL ORGANIC CHEMISTRYEXERCISE - SINGLE INTEGER ANSWER TYPE QUESTIONS
14 Videos
Similar Questions
The gas molecules randomly move in all directions and collide with each other and with the wall of the container. If is difficult to determine the speed of an individual molecule but it had become passible to work out the distribution of molecules among different molecular speeds. This is known as Maxwell Boltzmann distribution
consider the following graph about Maxwell's distribution of speed at two different temperature T1 and T2
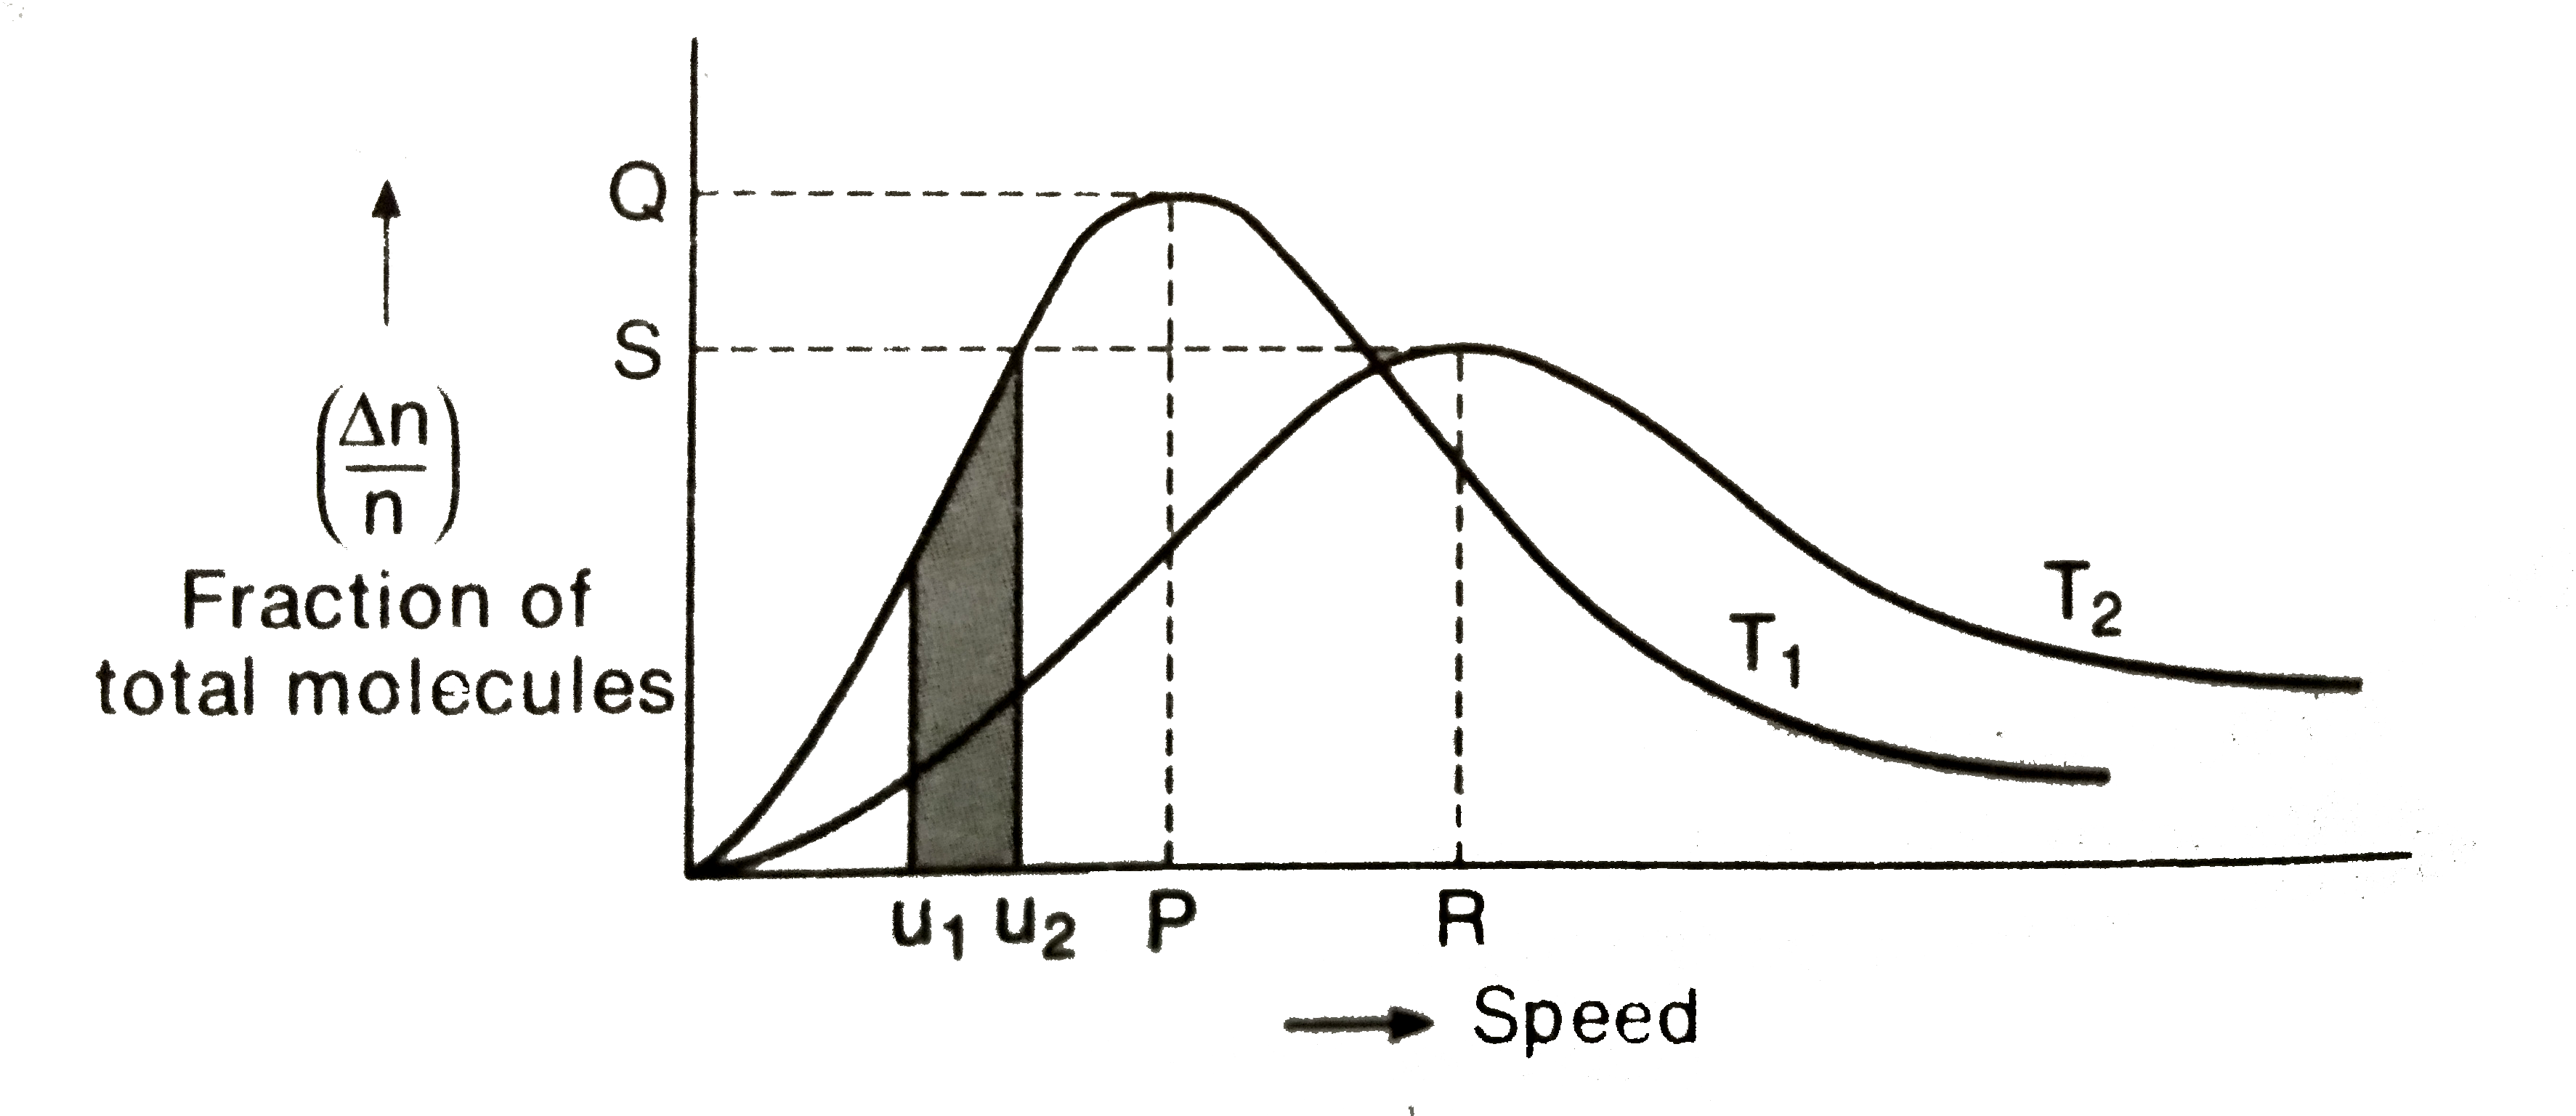
Total area under the curve at T1 is :
View SolutionThe gas molecules randomly move in all directions and collide with each other and with the wall of the container. If is difficult to determine the speed of an individual molecule but it had become passible to work out the distribution of molecules among different molecular speeds. This is known as Maxwell Boltzmann distribution
consider the following graph about Maxwell's distribution of speed at two different temperature T1 and T2
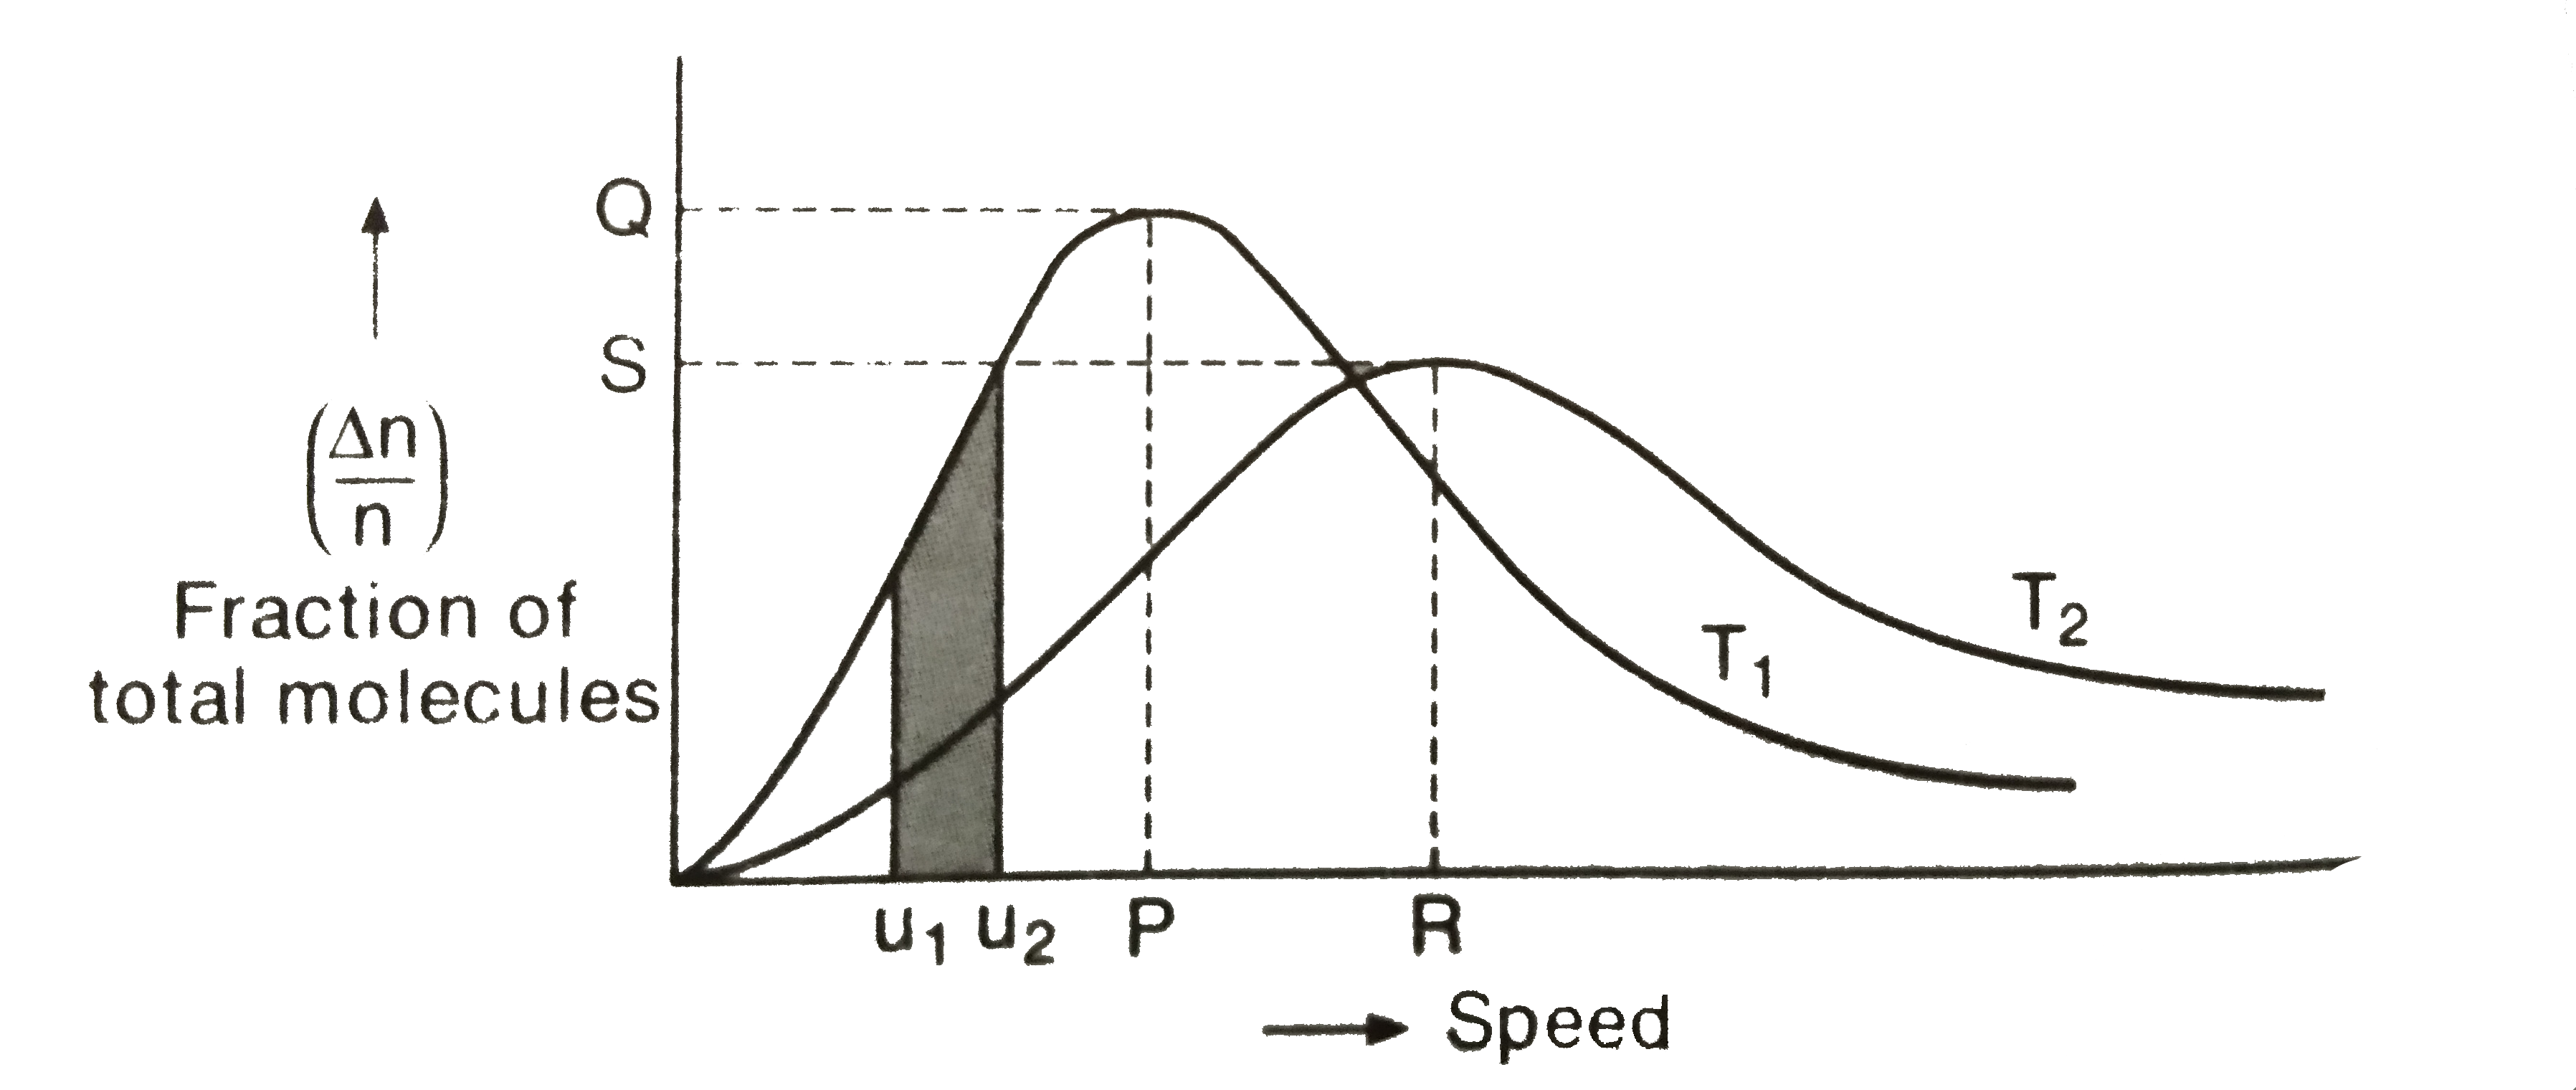
The shaded area represents :
View Solution
Knowledge Check
The gas molecules randomly move in an directions and collide with each other and with the wall of the container. It is dificult to detemine the speed of an individual molecule but it has become possible to Work out the distribution of molecules among different molecular speeds. This is known as Maxwell
Boltzmann distribution.
Consider the following graph about Maxwell's distribution of speeds at two different temperatures T1andT2 and answer the following questions:
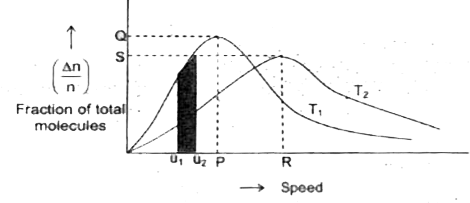
The shaded area representsAnumber of molecules having speed between u1andu2Bnumber of molecules having speed less than the most probable speedCnumber of molecules having VrmsandT1Dfraction of total molecules having average speedThe gas molecules randomly move in an directions and collide with each other and with the wall of the container. It is dificult to detemine the speed of an individual molecule but it has become possible to Work out the distribution of molecules among different molecular speeds. This is known as Maxwell
Boltzmann distribution.
Consider the following graph about Maxwell's distribution of speeds at two different temperatures T1andT2 and answer the following questions:
In the above graph the point P' refers toAroot mean square speed at T1Baverage speed at T1Cmost probable speed at T1Dhighest possible speed at T1The gas molecules randomly move in all directions and collide with each other and with the wall of the container. If is difficult to determine the speed of an individual molecule but it had become passible to work out the distribution of molecules among different molecular speeds. This is known as Maxwell Boltzmann distribution
consider the following graph about Maxwell's distribution of speed at two different temperature T1 and T2
The point Q refers to:Anumber of molecules with speed at PBfraction of total molecules with speed at PCroot mean square speedDtotal kinetic energy of molecules at P
The gas molecules randomly move in all directions and collide with each other and with the wall of the container. If is difficult to determine the speed of an individual molecule but it had become passible to work out the distribution of molecules among different molecular speeds. This is known as Maxwell Boltzmann distribution
consider the following graph about Maxwell's distribution of speed at two different temperature T1 and T2
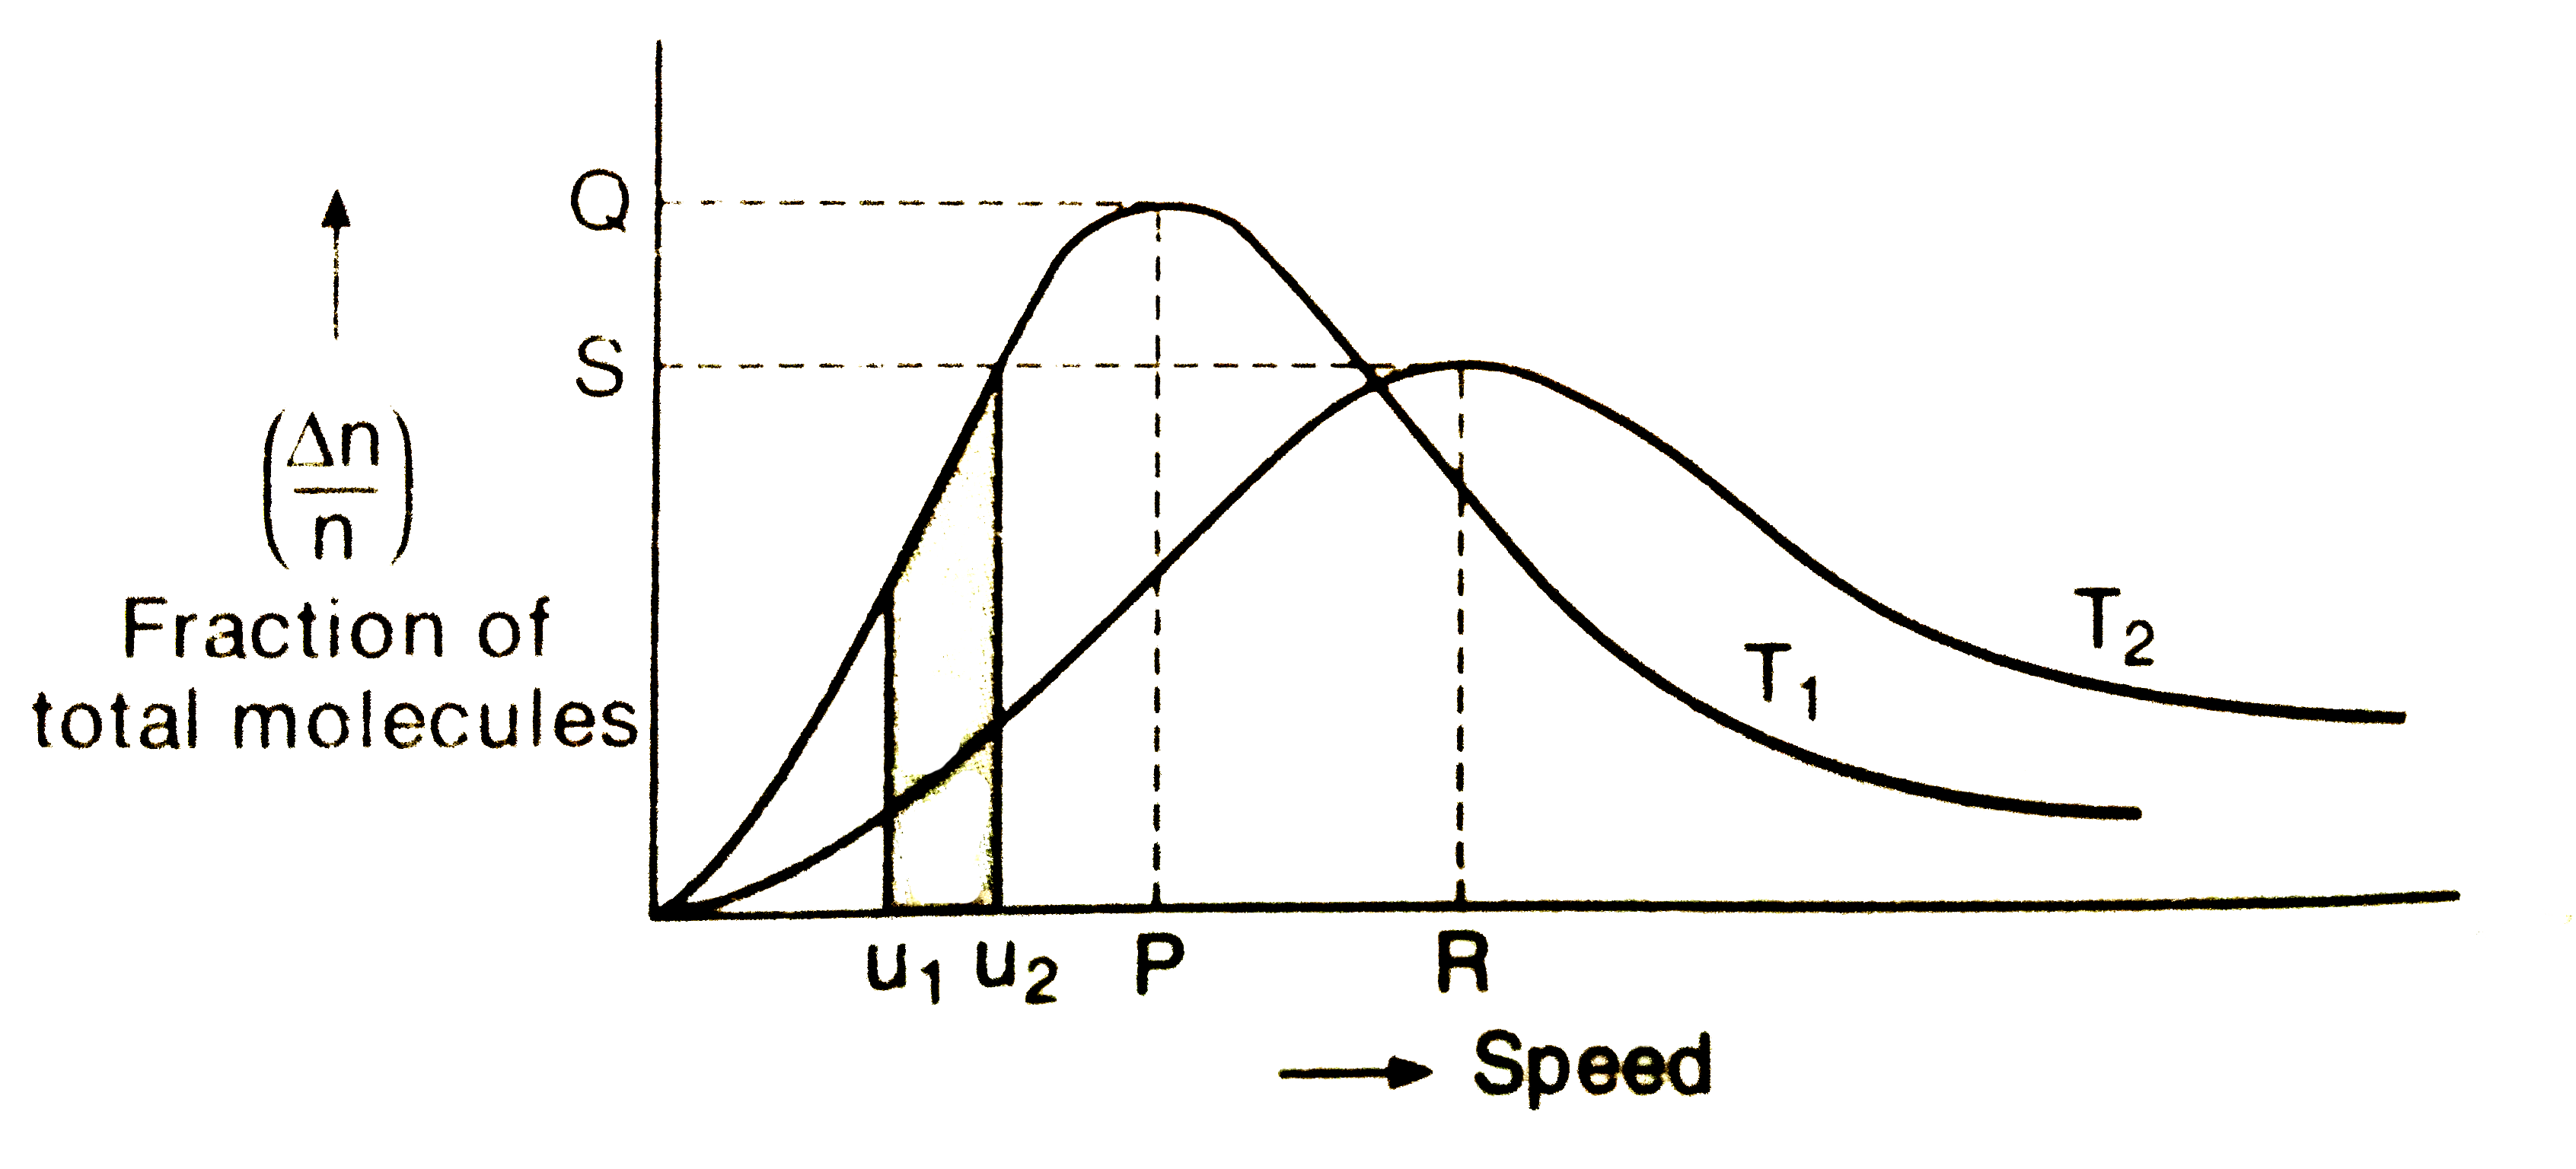
Select the correct statement (s):
View SolutionThe gas molecules randomly move in all directions and collide with each other and with the wall of the container. If is difficult to determine the speed of an individual molecule but it had become passible to work out the distribution of molecules among different molecular speeds. This is known as Maxwell Boltzmann distribution
consider the following graph about Maxwell's distribution of speed at two different temperature T1 and T2
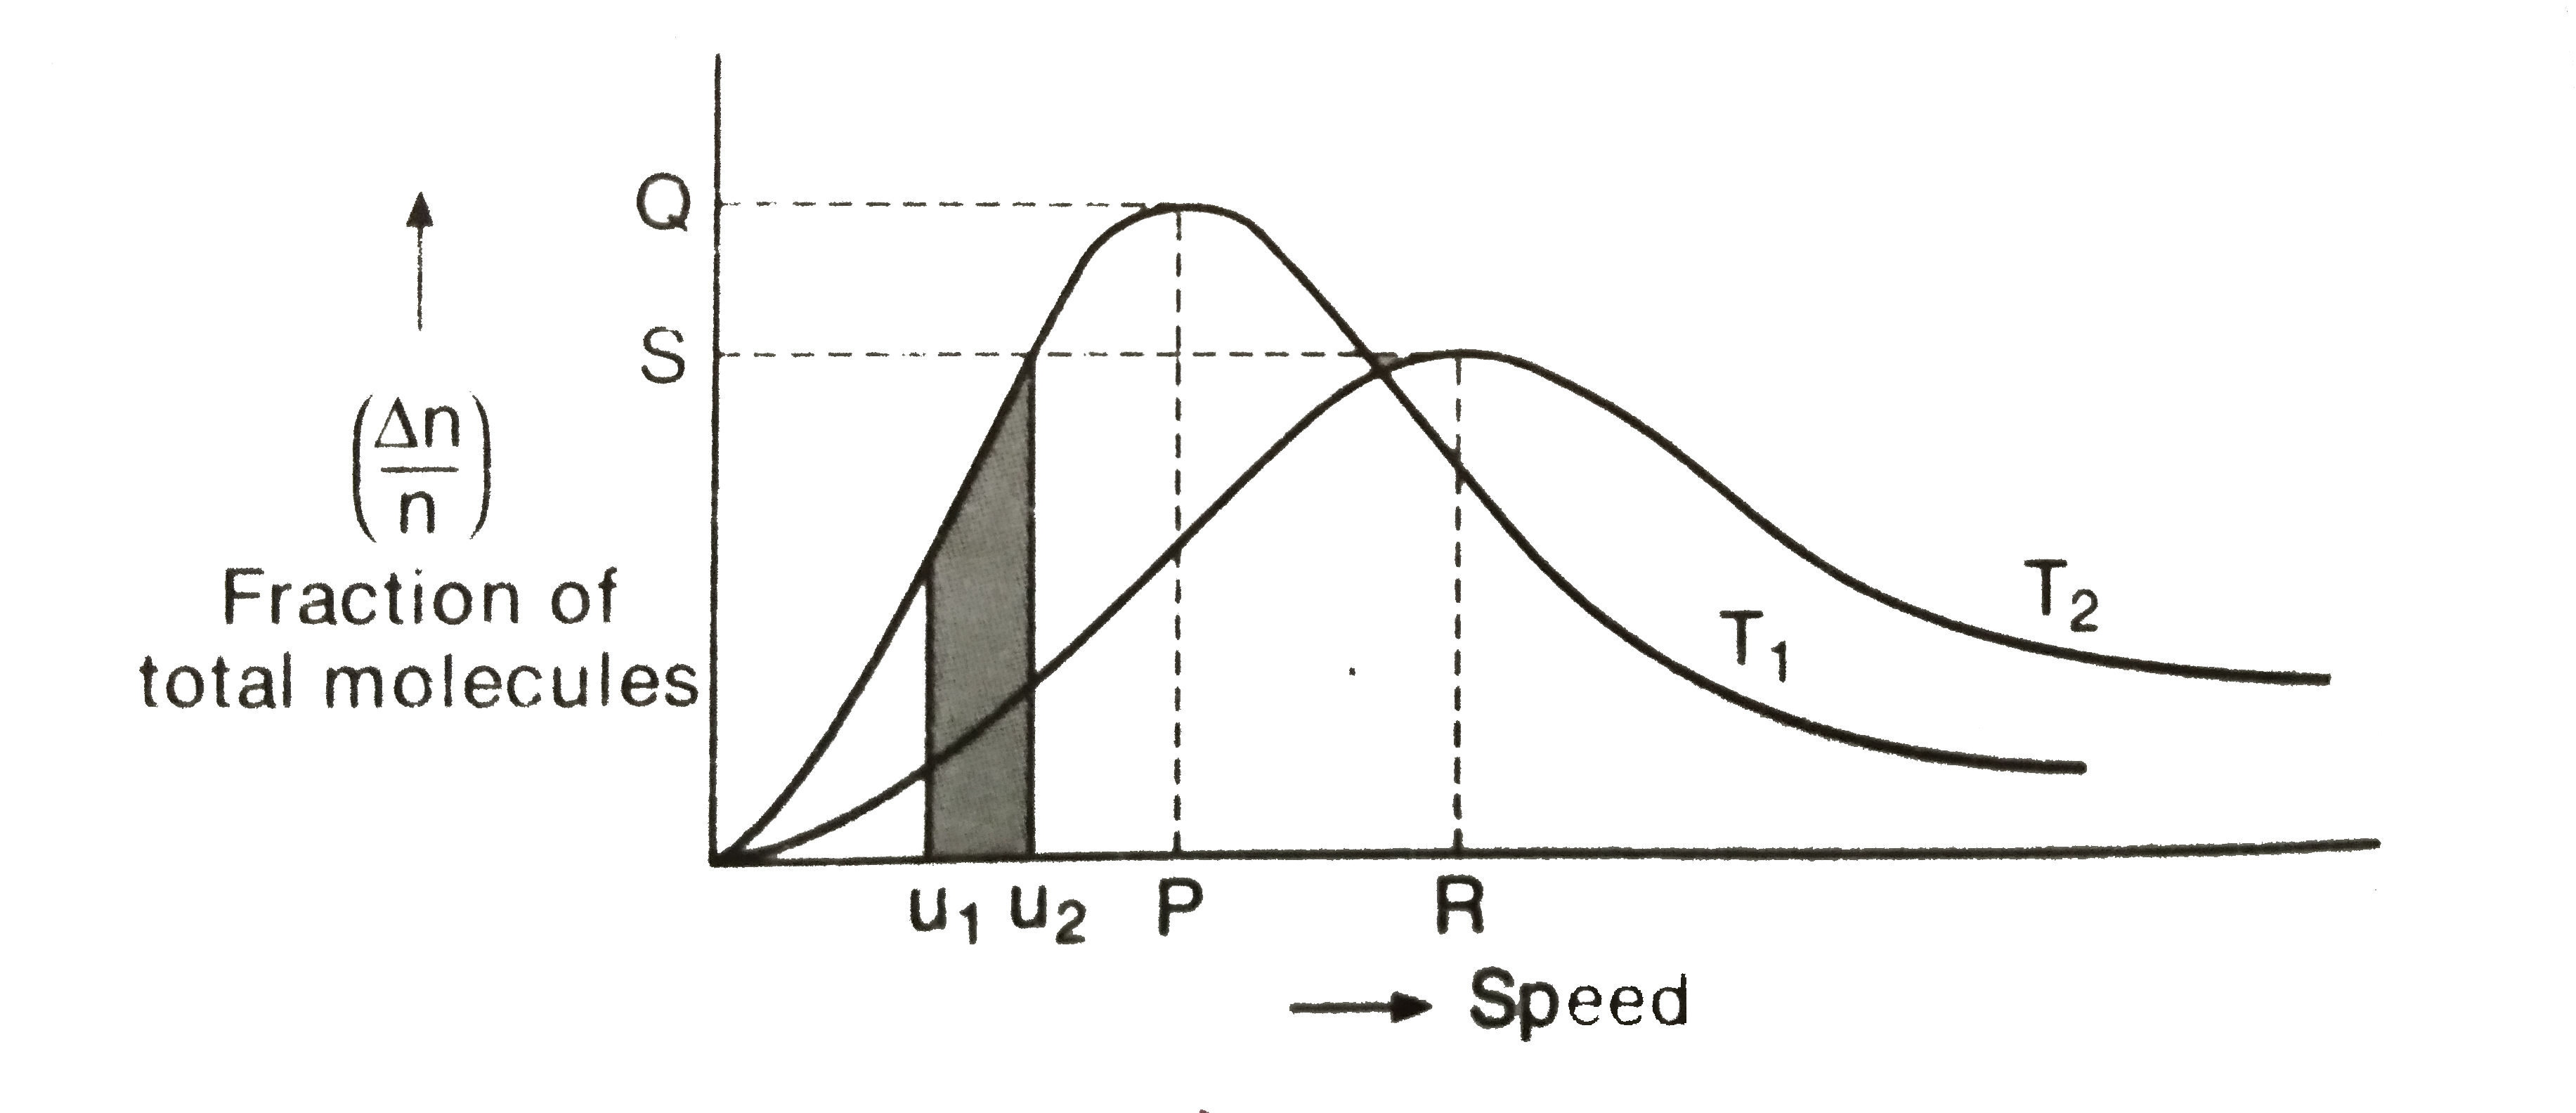
Relation between T1and T2 is :
View SolutionThe gas molecules randomly move in all directions and collide with each other and with the wall of the container. If is difficult to determine the speed of an individual molecule but it had become passible to work out the distribution of molecules among different molecular speeds. This is known as Maxwell Boltzmann distribution
consider the following graph about Maxwell's distribution of speed at two different temperature T1 and T2
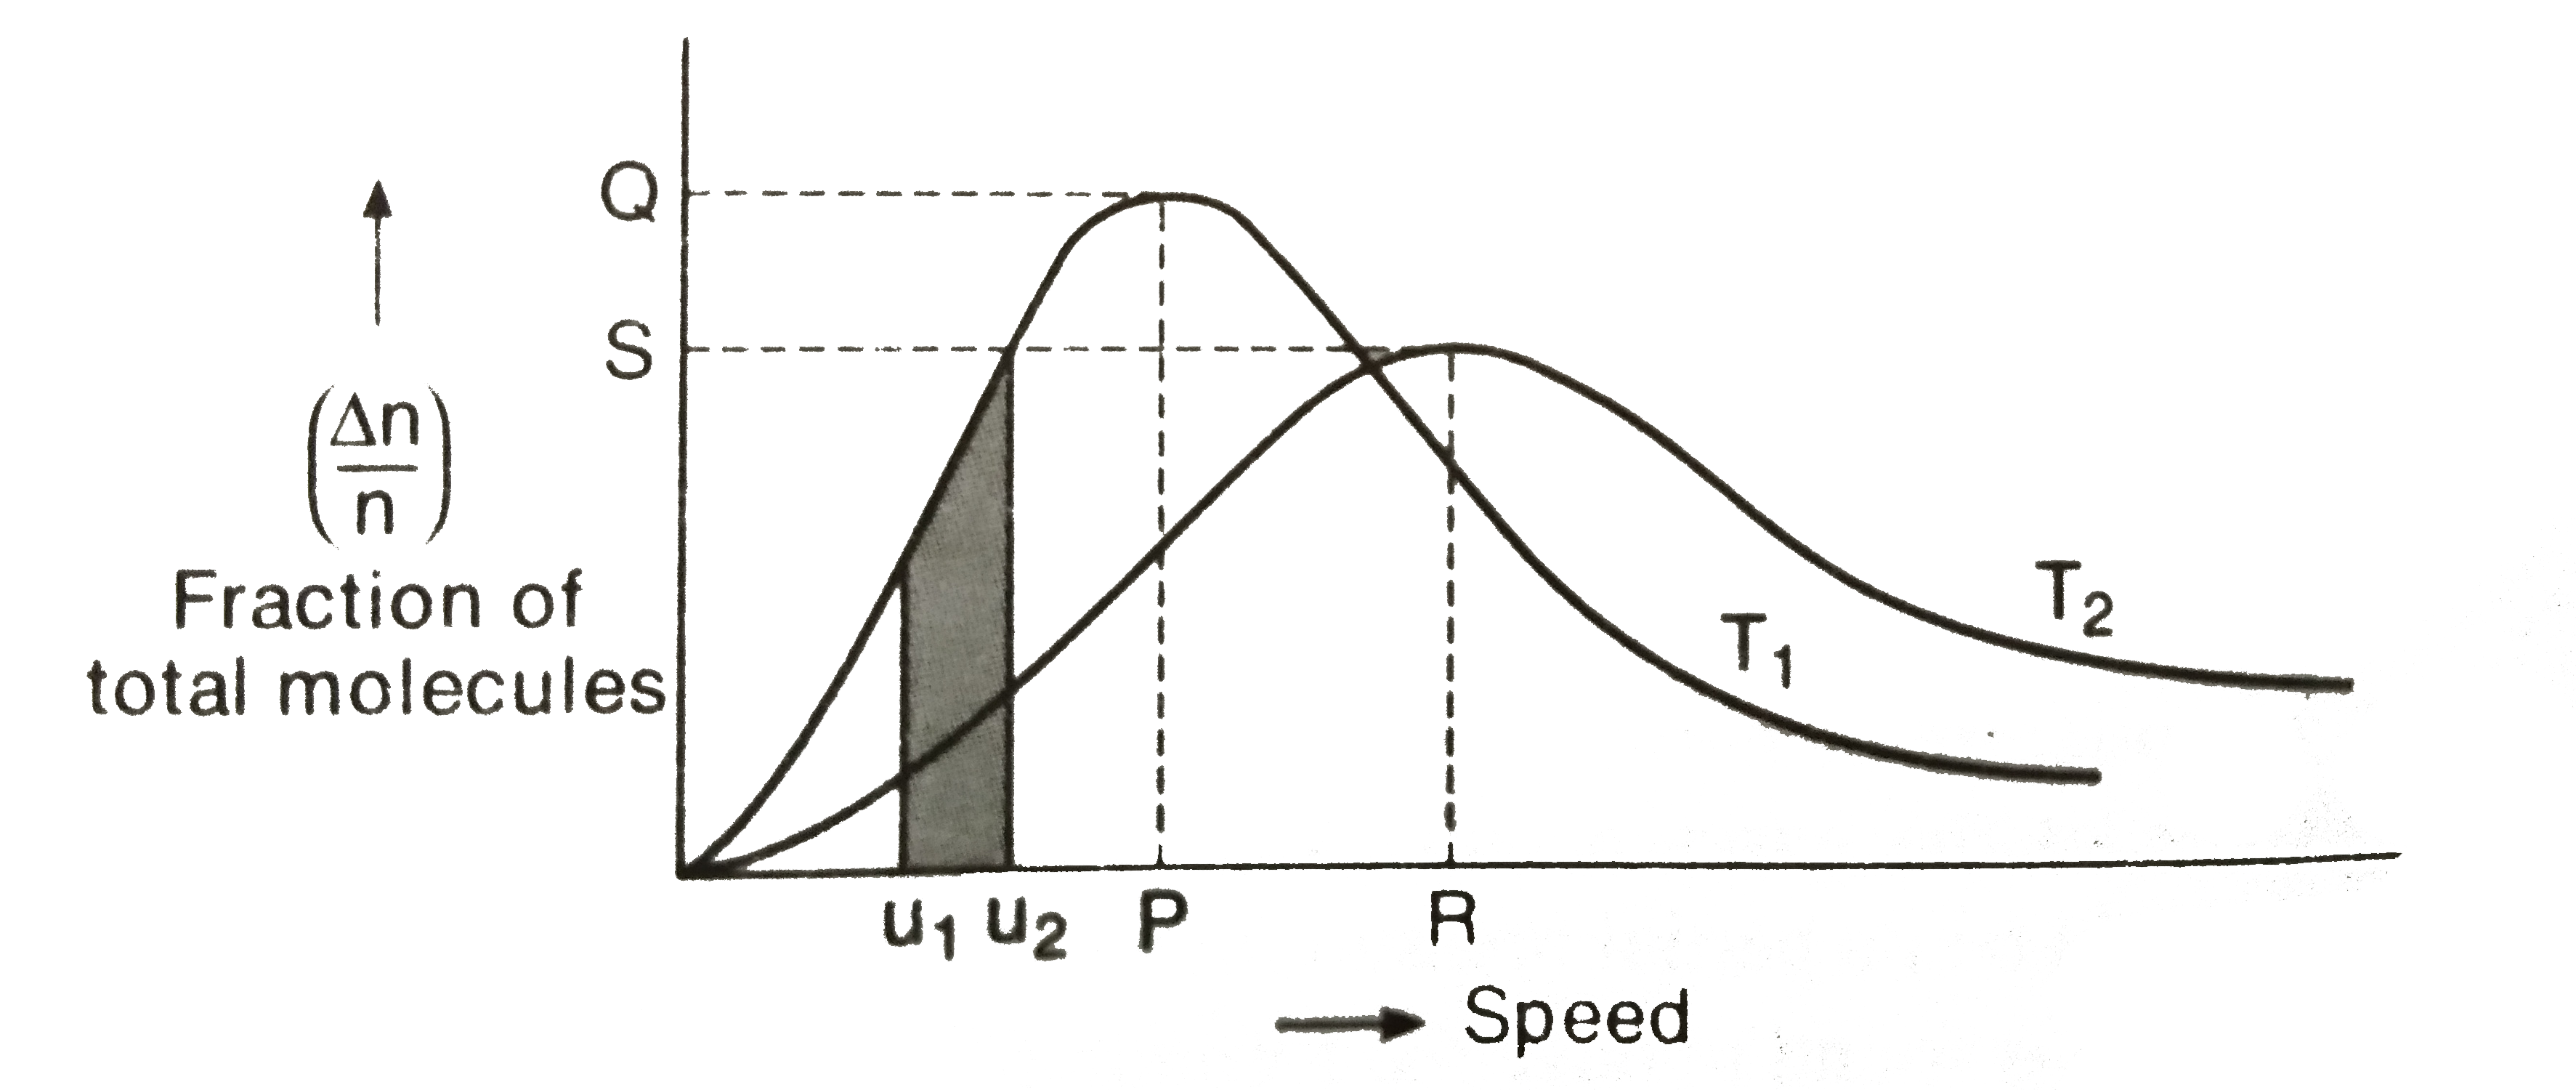
In the above graph the point 'P' refers to :
View SolutionThe gas molecules randomly move in all directions and collide with each other and with the wall of the container. If is difficult to determine the speed of an individual molecule but it had become passible to work out the distribution of molecules among different molecular speeds. This is known as Maxwell Boltzmann distribution
consider the following graph about Maxwell's distribution of speed at two different temperature T1 and T2
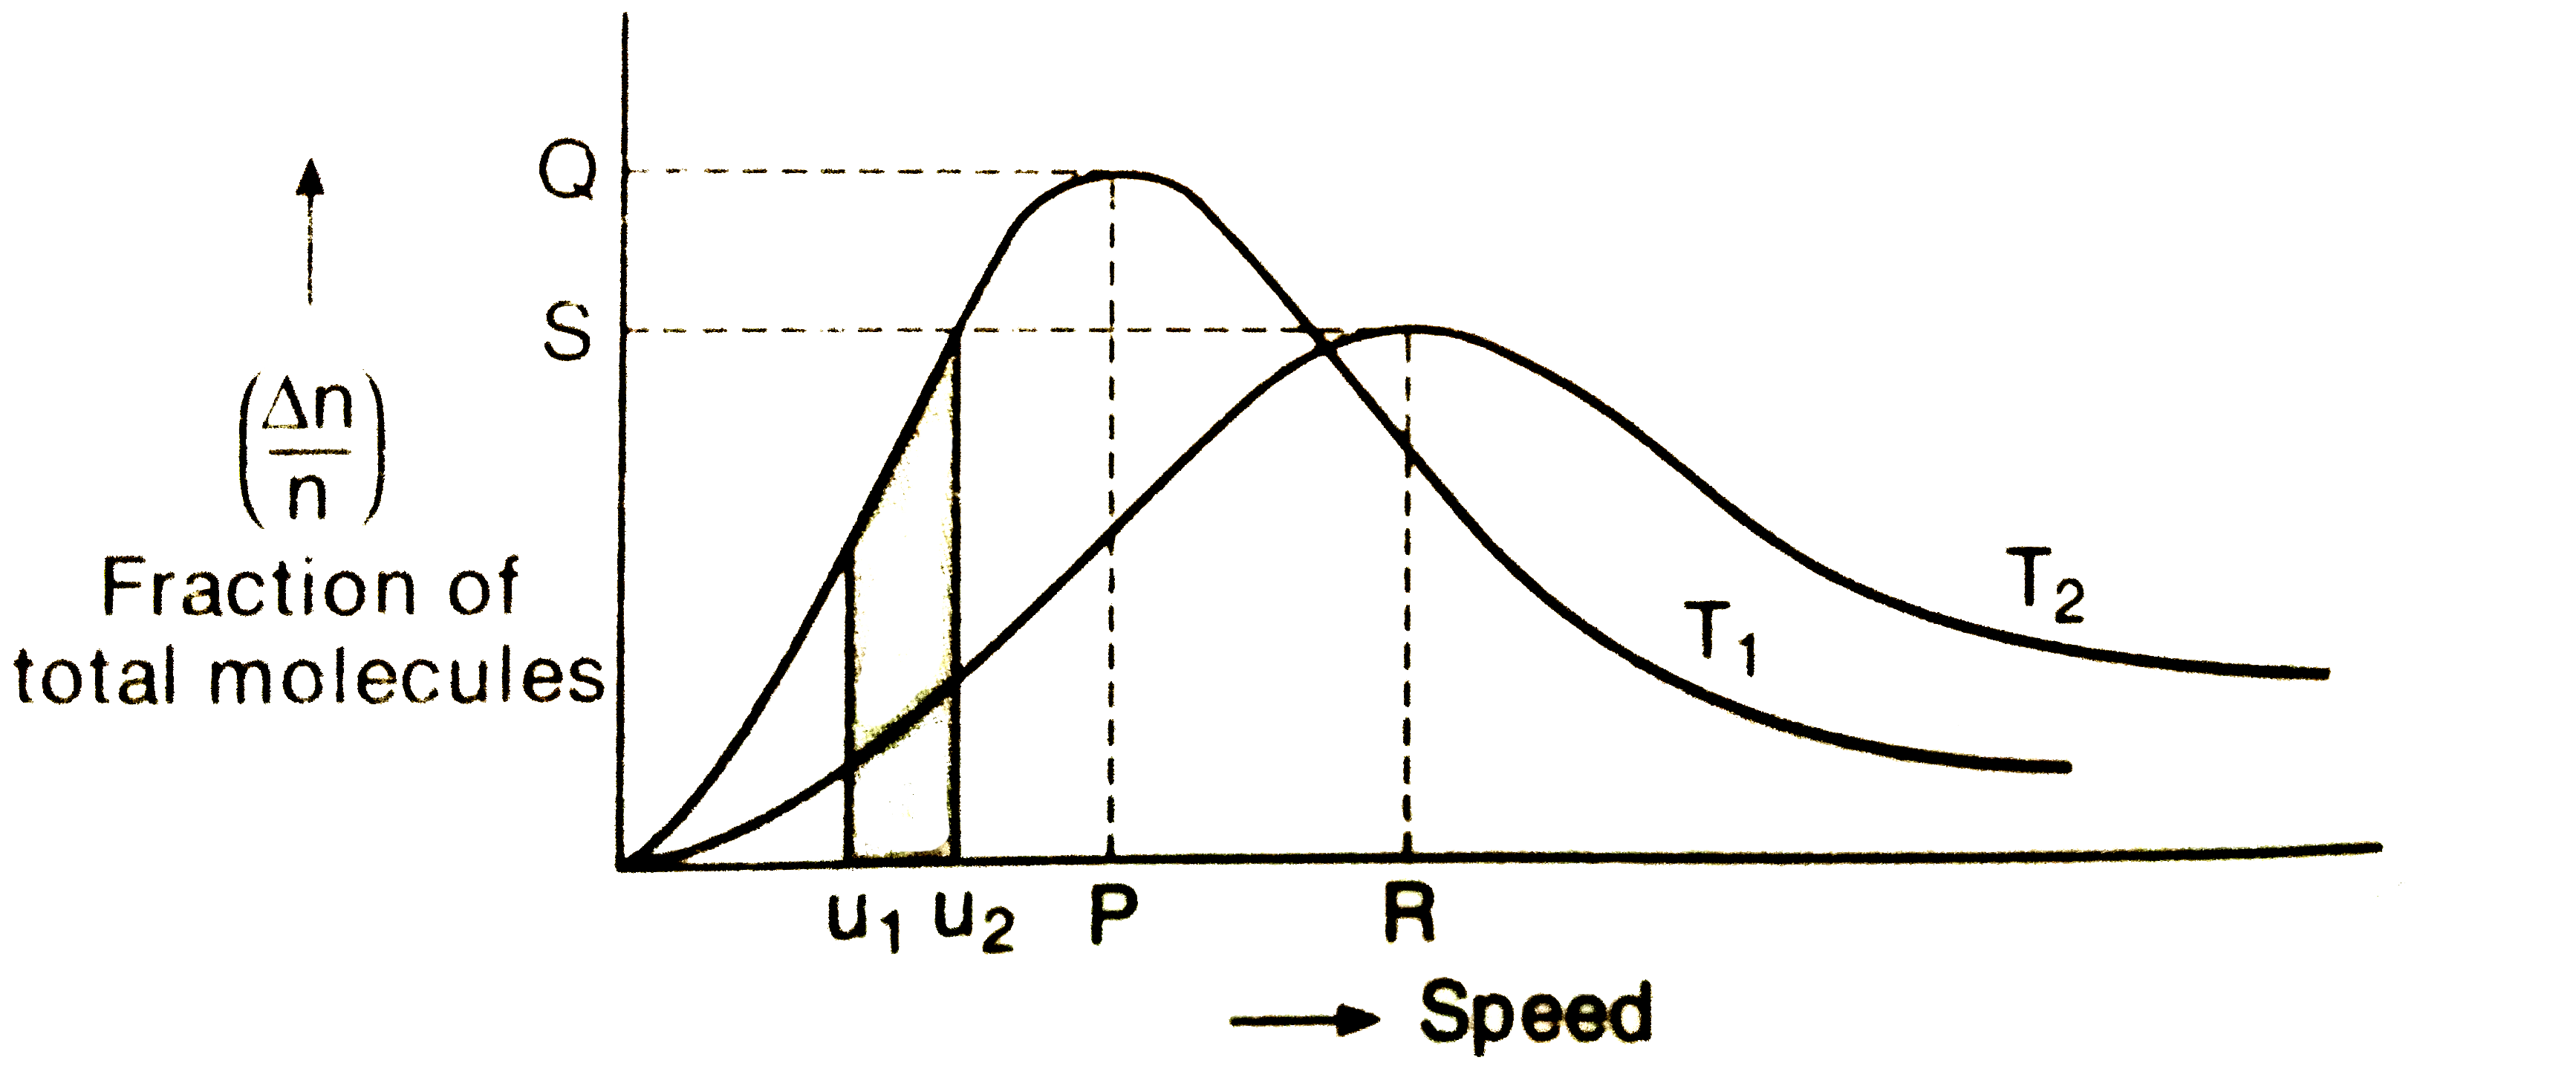
The curve has which of the following characteristics ?
(i) It has symmetrical distribution of molecules against molecular velocity
(ii) The area under the curve gives the total number of molecules.
(iii) The maxima of teh curve shifts towards right as the temperature is raised.
(iv) The area under the curve is independent of temperature
Select the correct statements from the codes given below:
View SolutionAccording to Maxwell Boltzmann distribution of energy
View Solution
