Which of the following gas always shows positive deviation from ideal gas behaviour ?
H2
CO2
NH3
CH4
The correct Answer is:A
To determine which gas always shows positive deviation from ideal gas behavior, we need to understand the concept of the compressibility factor (Z).
1. Understanding Ideal Gas Behavior:
- An ideal gas follows the ideal gas law, represented as PV = nRT. For ideal gases, the compressibility factor (Z) is equal to 1.
- When Z = 1, the gas behaves ideally.
2. Positive and Negative Deviations:
- If Z > 1, the gas shows positive deviation from ideal behavior. This means the gas occupies more volume than predicted by the ideal gas law.
- If Z < 1, the gas shows negative deviation from ideal behavior, meaning it occupies less volume than predicted.
3. Identifying Gases with Positive Deviation:
- We need to identify which gases consistently exhibit Z > 1. Common gases that show positive deviation include hydrogen (H2) and helium (He).
- In the options provided (H2, CO2, NH3, CH4), we need to analyze their behavior.
4. Analyzing the Given Gases:
- H2 (Hydrogen): Known to show positive deviation due to weak intermolecular forces.
- CO2 (Carbon Dioxide): Typically shows negative deviation at high pressures due to strong intermolecular attractions.
- NH3 (Ammonia): Exhibits strong hydrogen bonding, leading to negative deviation.
- CH4 (Methane): Generally behaves closer to ideal but can show deviations depending on conditions.
5. Conclusion:
- Among the gases listed, hydrogen (H2) is the one that consistently shows positive deviation from ideal gas behavior.
Final Answer:
The gas that always shows positive deviation from ideal gas behavior is Hydrogen (H2).
- An ideal gas follows the ideal gas law, represented as PV = nRT. For ideal gases, the compressibility factor (Z) is equal to 1.
- When Z = 1, the gas behaves ideally.
- If Z > 1, the gas shows positive deviation from ideal behavior. This means the gas occupies more volume than predicted by the ideal gas law.
- If Z < 1, the gas shows negative deviation from ideal behavior, meaning it occupies less volume than predicted.
- We need to identify which gases consistently exhibit Z > 1. Common gases that show positive deviation include hydrogen (H2) and helium (He).
- In the options provided (H2, CO2, NH3, CH4), we need to analyze their behavior.
- H2 (Hydrogen): Known to show positive deviation due to weak intermolecular forces.
- CO2 (Carbon Dioxide): Typically shows negative deviation at high pressures due to strong intermolecular attractions.
- NH3 (Ammonia): Exhibits strong hydrogen bonding, leading to negative deviation.
- CH4 (Methane): Generally behaves closer to ideal but can show deviations depending on conditions.
- Among the gases listed, hydrogen (H2) is the one that consistently shows positive deviation from ideal gas behavior.
The gas that always shows positive deviation from ideal gas behavior is Hydrogen (H2).
Topper's Solved these Questions
- STATES OF MATTERBOOK - AAKASH INSTITUTECHAPTER - STATES OF MATTEREXERCISE - ASSIGNMENT (SECTION-B)
32 Videos
- STATES OF MATTERBOOK - AAKASH INSTITUTECHAPTER - STATES OF MATTEREXERCISE - ASSIGNMENT (SECTION-C)
29 Videos
- STATES OF MATTERBOOK - AAKASH INSTITUTECHAPTER - STATES OF MATTEREXERCISE - TRY YOURSELF
34 Videos
- SOME BASIC CONCEPTS OF CHEMISTRY BOOK - AAKASH INSTITUTECHAPTER - SOME BASIC CONCEPTS OF CHEMISTRY EXERCISE - ASSIGNMENT SECTION J (Aakash Challenges Questions)
10 Videos
- STRUCTURE OF ATOMBOOK - AAKASH INSTITUTECHAPTER - STRUCTURE OF ATOMEXERCISE - ASSIGNMENT (SECTION -D) Assertion-Reason Type Questions
15 Videos
Similar Questions
Knowledge Check
Which of the following gases always show positive deviation from ideal behaviour with increase in pressure ?
ANH3BCO2CH2DCOWhich of the following graphs show most significant deviation from ideal gas behaviour ?
A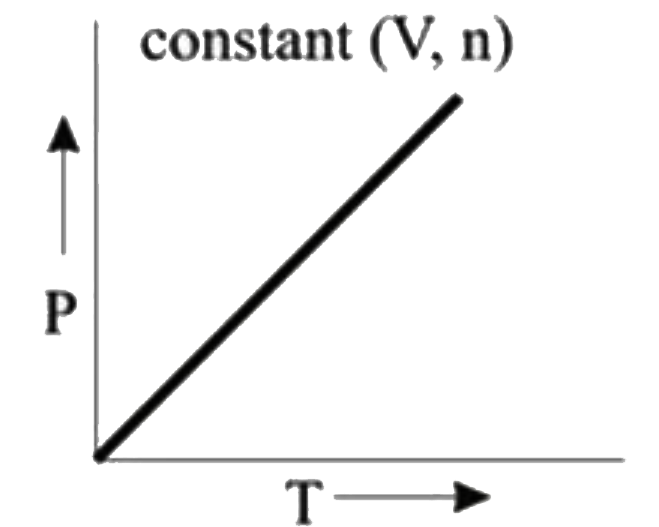 B
B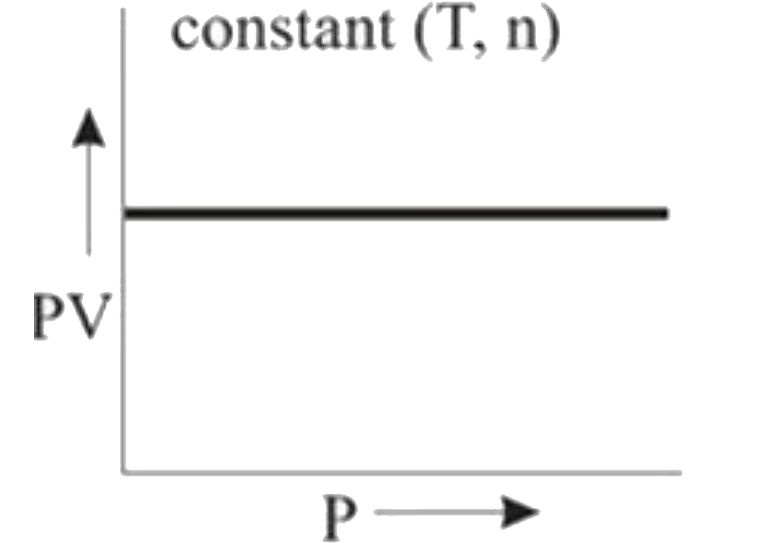 C
C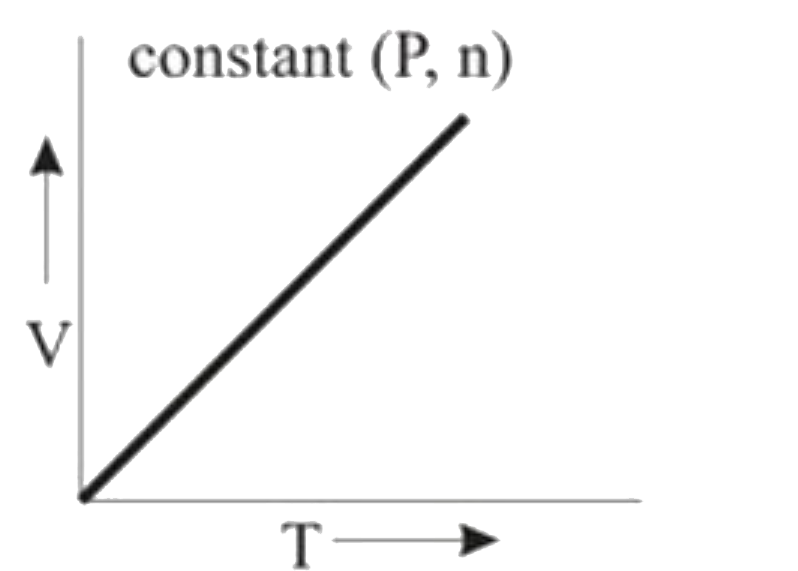 D
D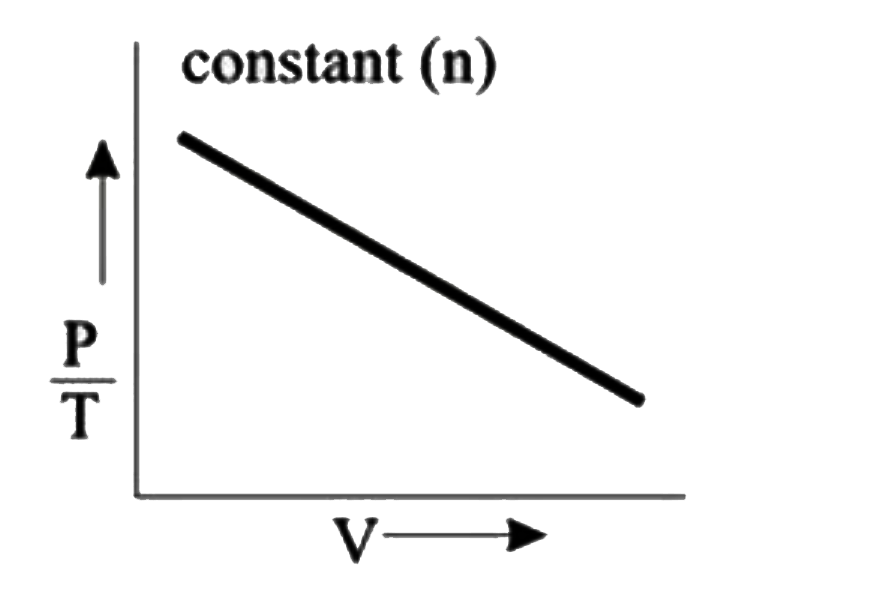
Which of the following graphs shows most significant deviation from ideal gas behavior
A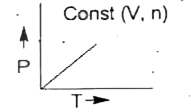 B
B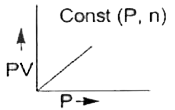 C
C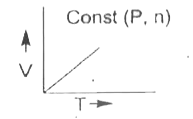 D
D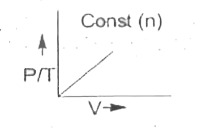
Any gas shows maximum deviation from ideal gas behaviour at
View SolutionAny gas shows maximum deviation from ideal gas behaviour at
View SolutionAny gas shows maximum deviation from ideal gas behaviour at
View SolutionA solution showing a large positive deviation from ideal behaviour have
View SolutionWhich of the following measure the deviation from ideal behaviour of gas?
View Solution
