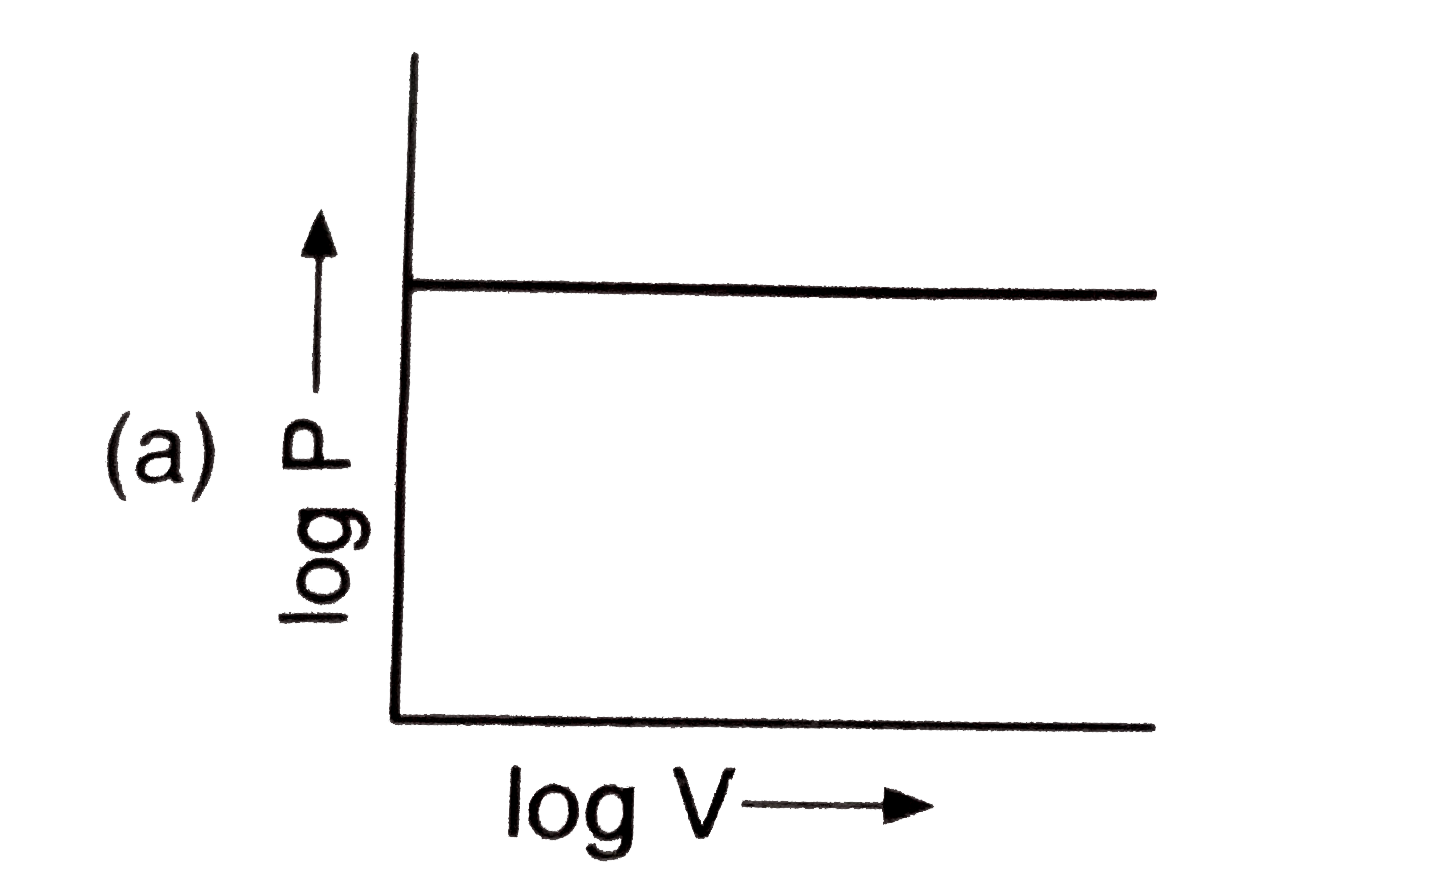
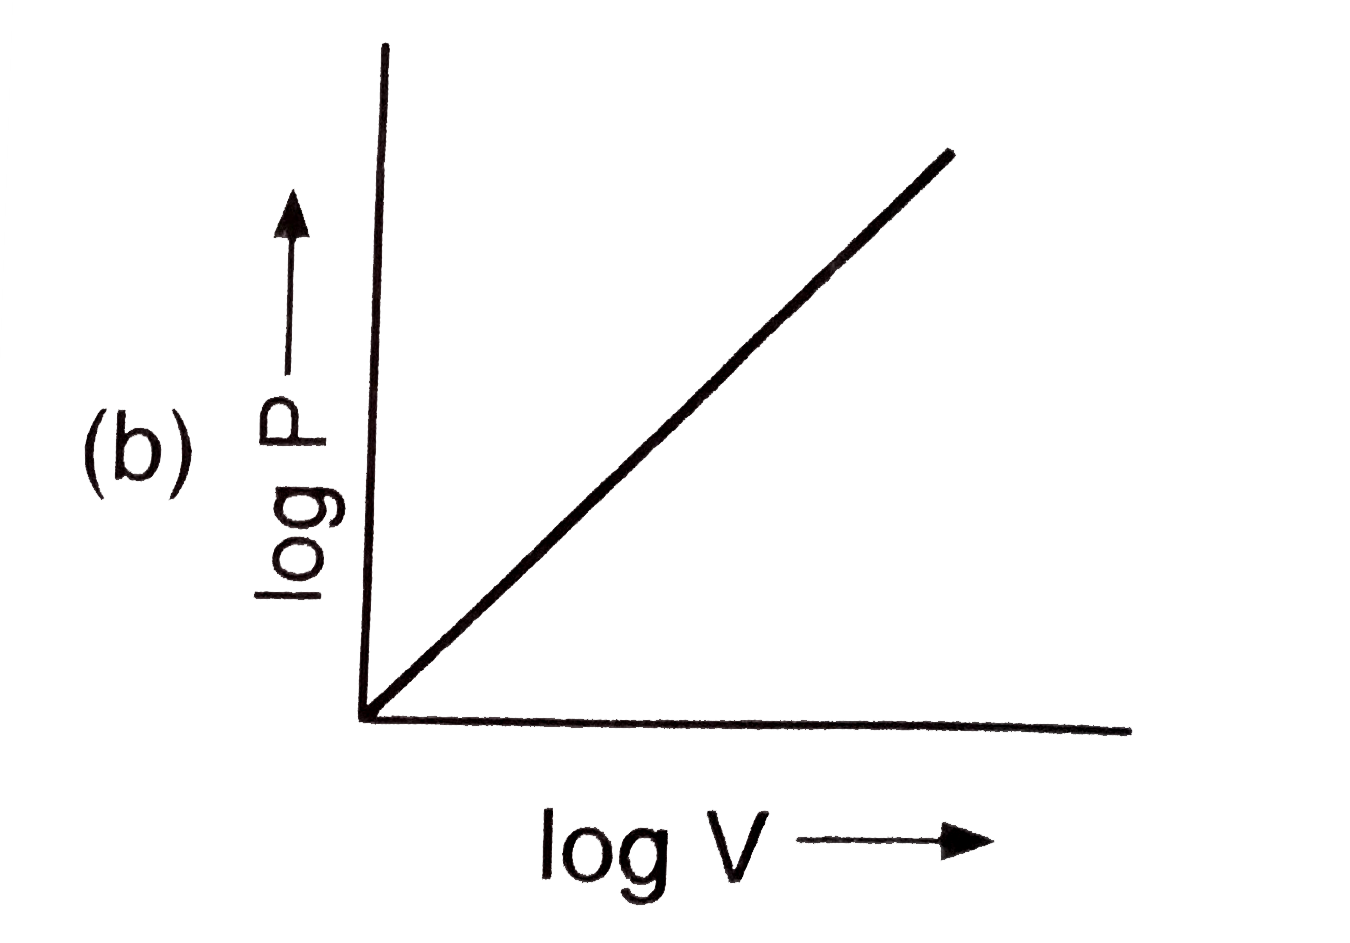
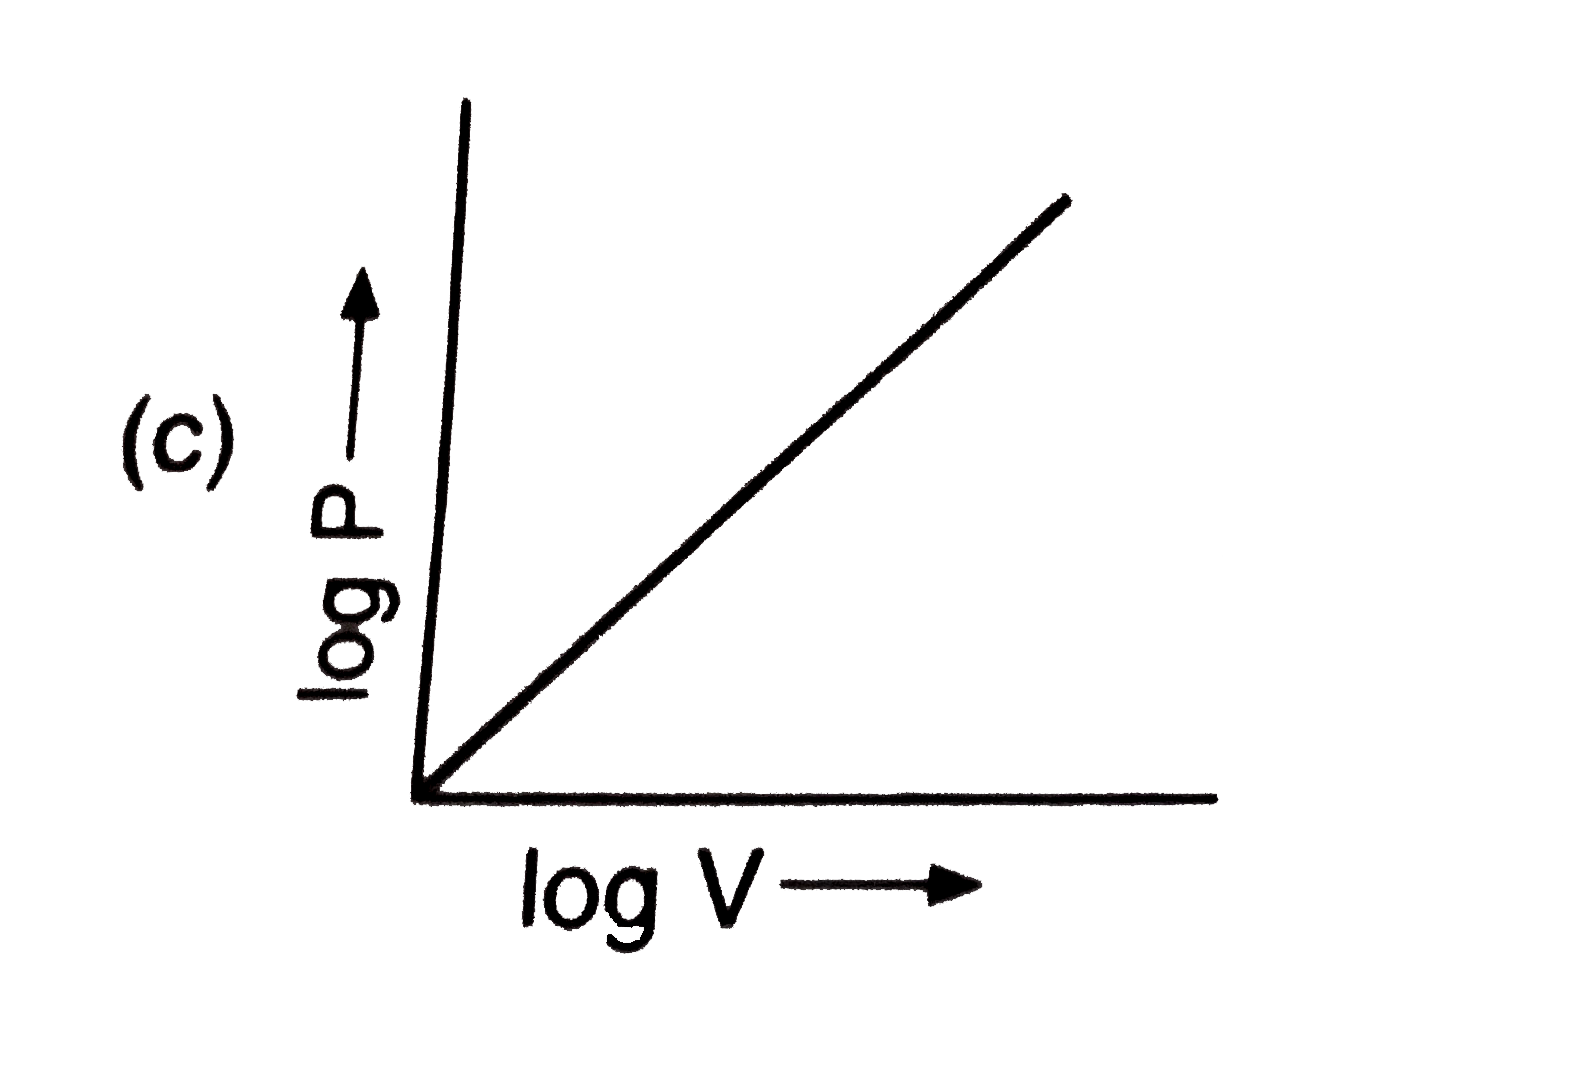
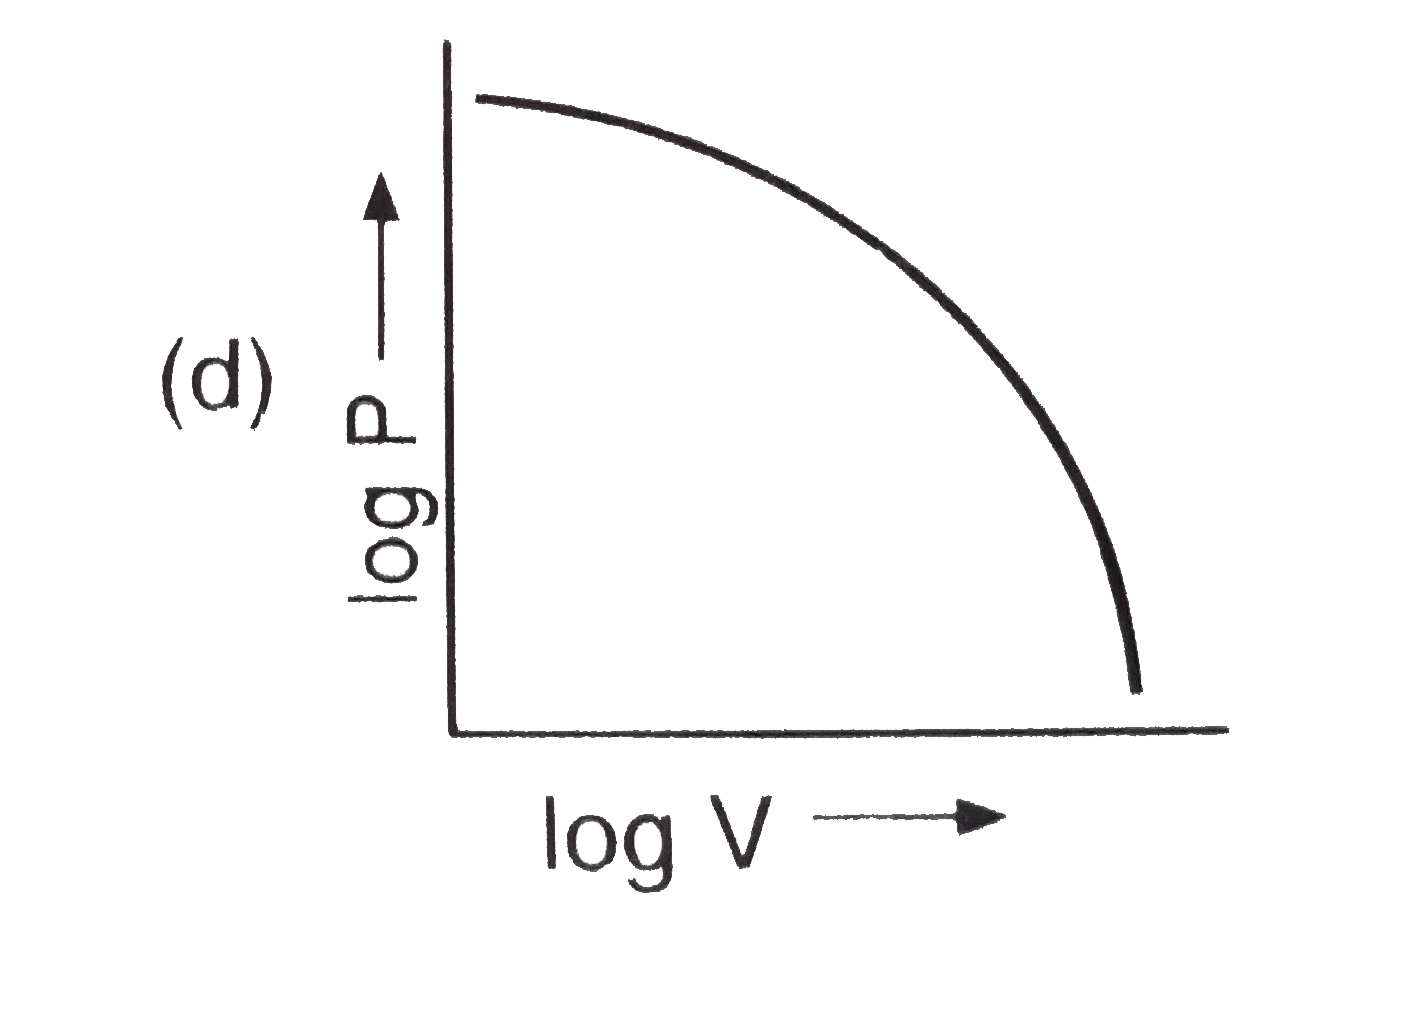
The slope of the graph between log P and log V at constant temperature for a given mass of gas is
+1
−1
1T
1n
The correct Answer is:B
To find the slope of the graph between log P and log V at constant temperature for a given mass of gas, we can start from the ideal gas law and manipulate it step by step.
1. Start with the Ideal Gas Law:
The ideal gas law is given by the equation:
PV=nRT
where P is the pressure, V is the volume, n is the number of moles of gas, R is the ideal gas constant, and T is the temperature.
2. Take the Logarithm of Both Sides:
Taking the logarithm of both sides gives:
log(PV)=log(nRT)
3. Use Logarithmic Properties:
We can use the property of logarithms that states log(ab)=loga+logb:
logP+logV=log(nRT)
4. Rearranging the Equation:
Rearranging this equation gives:
logP=log(nRT)−logV
This can be rewritten as:
logP=−logV+log(nRT)
5. Identify the Linear Form:
This equation is in the form of y=mx+c, where:
- y=logP
- x=logV
- m=−1 (the slope)
- c=log(nRT) (the y-intercept)
6. Conclusion:
From the above analysis, we can conclude that the slope of the graph between log P and log V at constant temperature for a given mass of gas is:
slope=−1
Final Answer:
The slope of the graph between log P and log V at constant temperature for a given mass of gas is −1.
The ideal gas law is given by the equation:
PV=nRT
where P is the pressure, V is the volume, n is the number of moles of gas, R is the ideal gas constant, and T is the temperature.
Taking the logarithm of both sides gives:
log(PV)=log(nRT)
We can use the property of logarithms that states log(ab)=loga+logb:
logP+logV=log(nRT)
Rearranging this equation gives:
logP=log(nRT)−logV
This can be rewritten as:
logP=−logV+log(nRT)
This equation is in the form of y=mx+c, where:
- y=logP
- x=logV
- m=−1 (the slope)
- c=log(nRT) (the y-intercept)
From the above analysis, we can conclude that the slope of the graph between log P and log V at constant temperature for a given mass of gas is:
slope=−1
The slope of the graph between log P and log V at constant temperature for a given mass of gas is −1.
Topper's Solved these Questions
- STATES OF MATTERBOOK - AAKASH INSTITUTECHAPTER - STATES OF MATTEREXERCISE - ASSIGNMENT (SECTION-C)
29 Videos
- STATES OF MATTERBOOK - AAKASH INSTITUTECHAPTER - STATES OF MATTEREXERCISE - ASSIGNMENT (SECTION-D)
15 Videos
- STATES OF MATTERBOOK - AAKASH INSTITUTECHAPTER - STATES OF MATTEREXERCISE - ASSIGNMENT (SECTION-A)
47 Videos
- SOME BASIC CONCEPTS OF CHEMISTRY BOOK - AAKASH INSTITUTECHAPTER - SOME BASIC CONCEPTS OF CHEMISTRY EXERCISE - ASSIGNMENT SECTION J (Aakash Challenges Questions)
10 Videos
- STRUCTURE OF ATOMBOOK - AAKASH INSTITUTECHAPTER - STRUCTURE OF ATOMEXERCISE - ASSIGNMENT (SECTION -D) Assertion-Reason Type Questions
15 Videos
Similar Questions
Knowledge Check
Graph between p and V at constant temperature is
AstraightBcurved increasingCstraight line with slopeDparabolic curve decreasingGraph between p and V at constant temperature is
AstraightBcurved increasingCstraight line with slopeDnone of theseThe plot of log V against log P at constant temperature for a fixed mass of gas is :
A B
B C
C D
D
The slope of the plot between pV and p at constant temperature is
View SolutionThe slope of the plot between pV and p at constant temperature is
View SolutionThe slope of the plot between pV and p at constant temperature is
View SolutionSlope of the plot between V and P at constant temperature
View SolutionThe graph between log R and log A wher R is the nuclear radius and A is the mass of is.
View Solution
