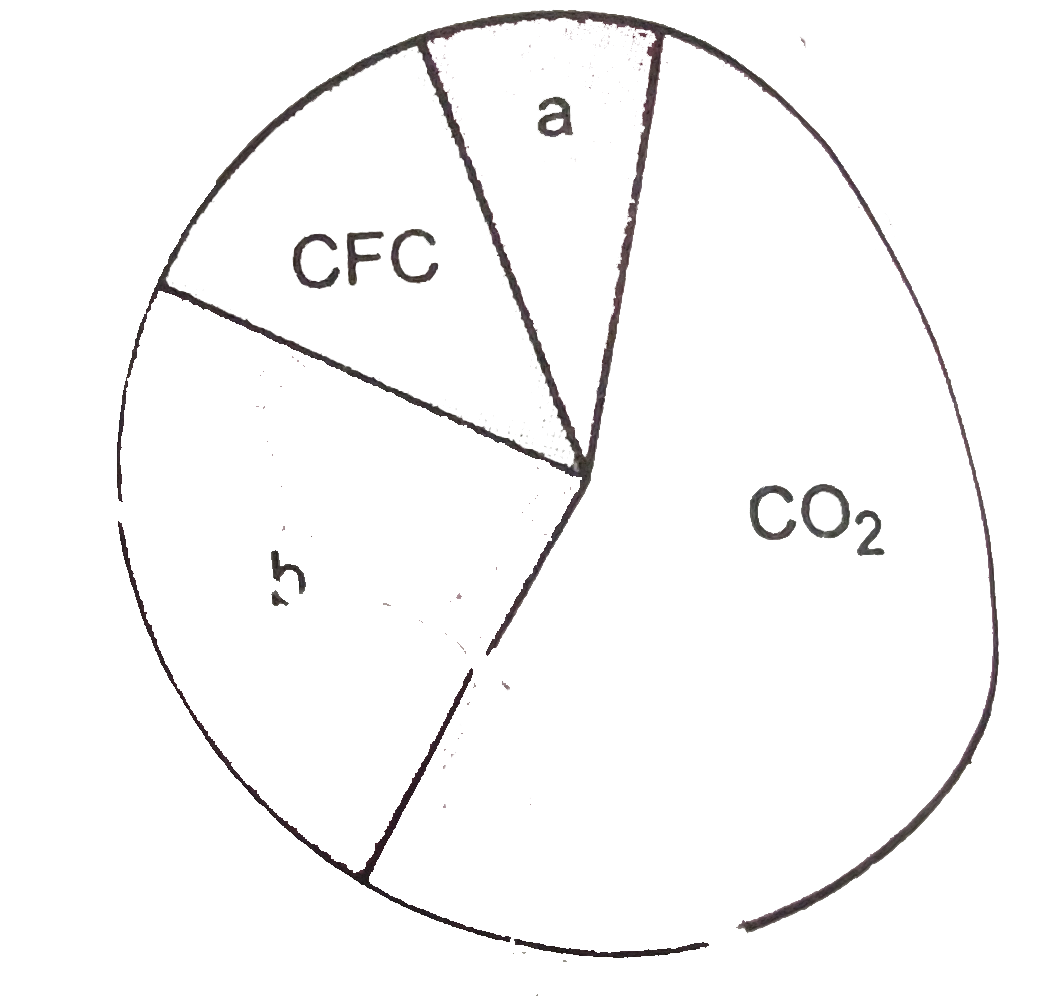
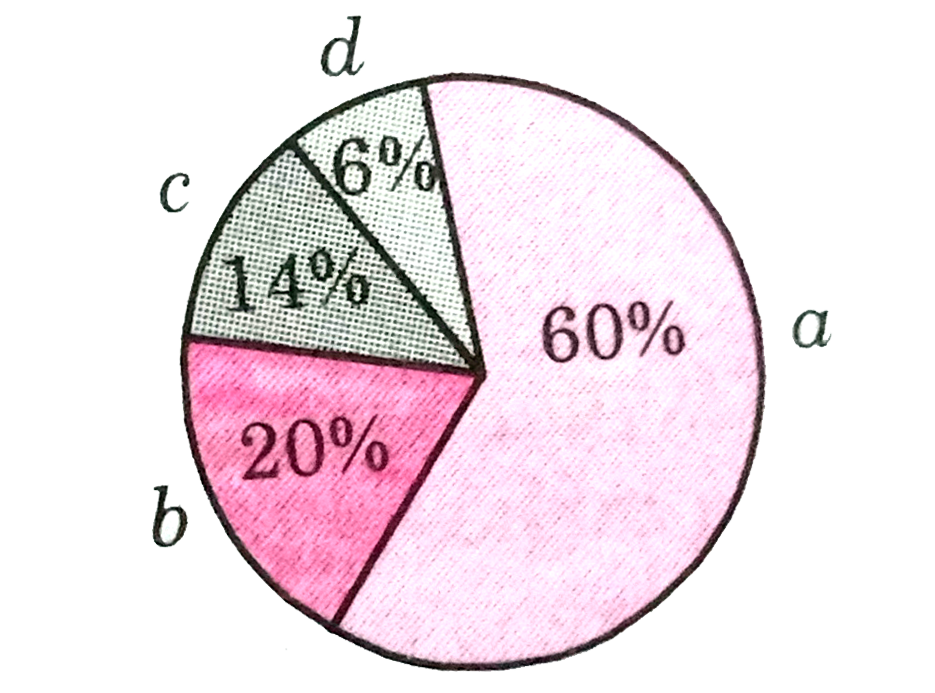
The figure given below shows relative contributions of various greenhouse gases to the total global warming .
(i) Name the gases (a) and (b).
(ii) Explain how increase in greenhous gases in earth's atmosphere leads to melting of ice caps .

i. a.N2O
b. Methane (CH4)
ii. The rise in temperature is leading to deleterious changes in the enviroment and results in climatic changes. Thus leading to increased melting of polar ice caps as well as of other places like the Himalayan snow caps.
Topper's Solved these Questions
- ENVIRONMENTAL ISSUES BOOK - NEW JOYTHI PUBLICATIONCHAPTER - ENVIRONMENTAL ISSUES EXERCISE - CONTINUOUS EVALUTION (PROJECT)
2 Videos
- ENVIRONMENTAL ISSUES BOOK - NEW JOYTHI PUBLICATIONCHAPTER - ENVIRONMENTAL ISSUES EXERCISE - PREVIOUS ENTRANCE EXAM CORNER
30 Videos
- ECOSYSTEM BOOK - NEW JOYTHI PUBLICATIONCHAPTER - ECOSYSTEM EXERCISE - Continuous Evaluation (Project)
2 Videos
- EVOLUTION BOOK - NEW JOYTHI PUBLICATIONCHAPTER - EVOLUTION EXERCISE - Previous Year Competitive Exam Questions(MCQs)
50 Videos
Similar Questions
The figure shows relative contributions of various green house gases to the total global warming.
(i) Name the gases (a) and (b)
(ii) Explain how increase in green-house gases in earth's atmosphere leads to rise in sea level?
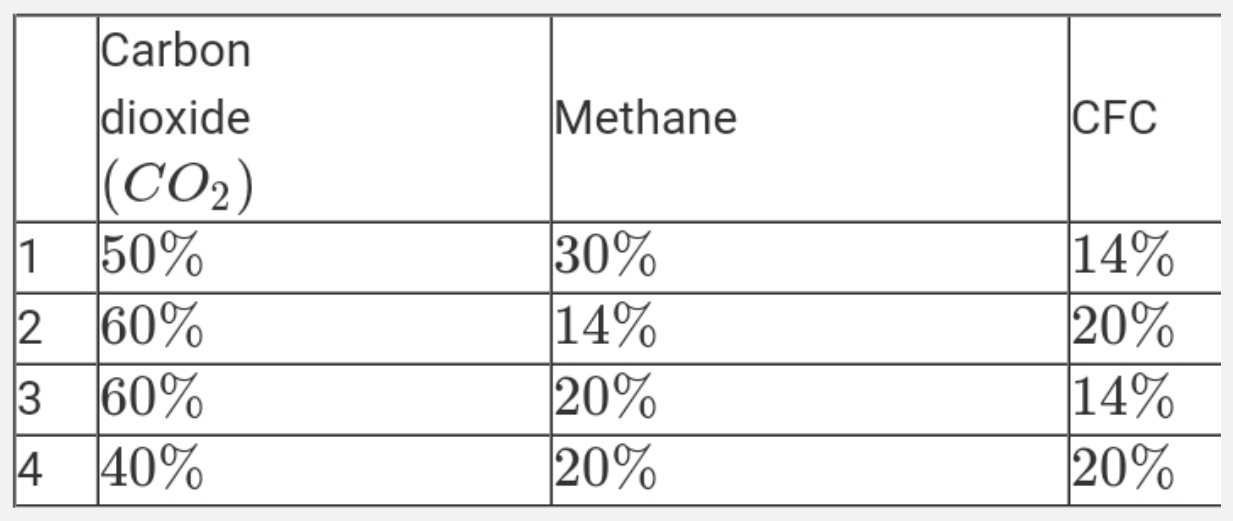
View SolutionSelect the correct option by identifying the relative contribution of various greenhouse gases to the total global warming.
View Solution
Knowledge Check
Given pie-diagram represents the relative contribution of various greenhouse gases to total global warming. Identify the gases P, Q, R and S.
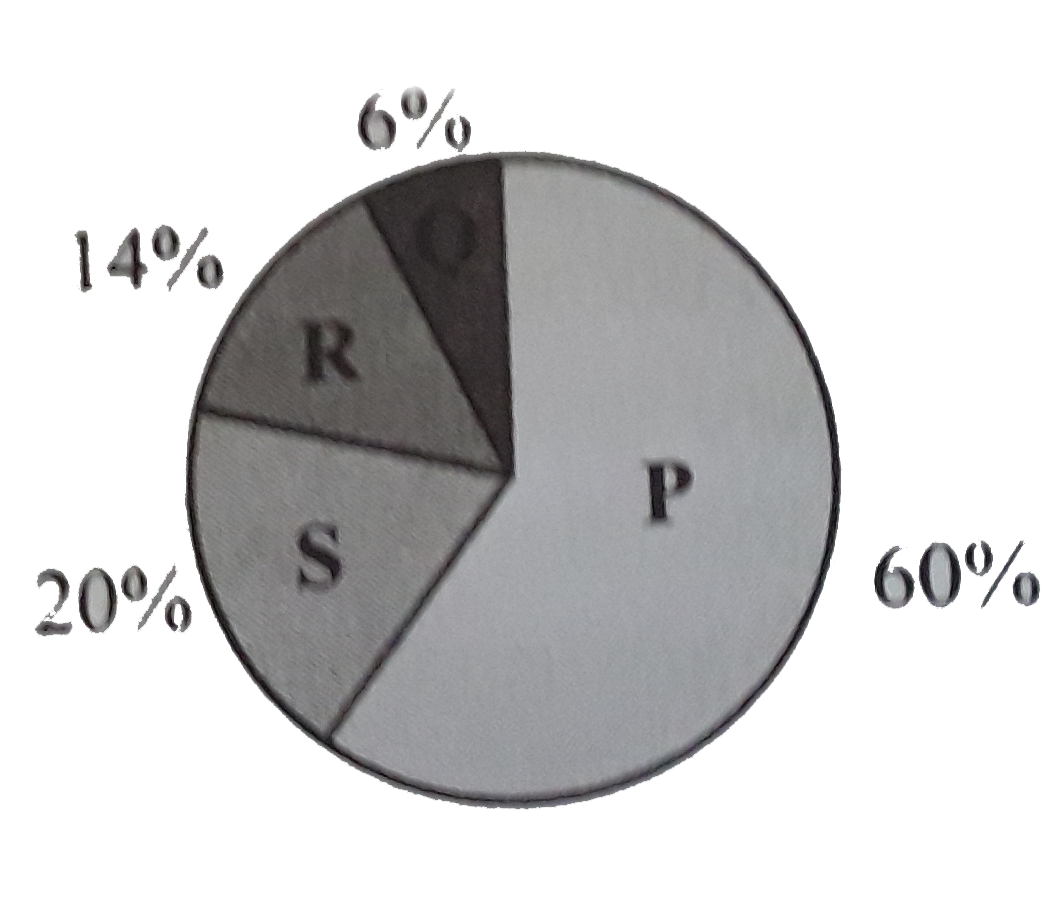 APQRSN2OCFCsCO2MethaneBPQRSN2OMethaneCFCsCO2CPQRSCO2N2OCFCsMethaneDPQRSCO2CFCsN2OMethane
Given pie-diagram represents the relative contribution of various greenhouse gases to total global warming. Identify the gases P, Q, R and S.
 APQRSN2OCFCsCO2MethaneBPQRSN2OMethaneCFCsCO2CPQRSCO2N2OCFCsMethaneDPQRSCO2CFCsN2OMethane
Which of the following figures shows correct relative contribution of greenhouse gases to global warming?
A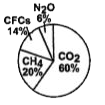 B
B C
C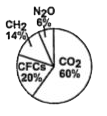 D
D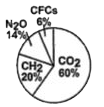
The figure is showing relative contribution of various green house gases to total global warming.
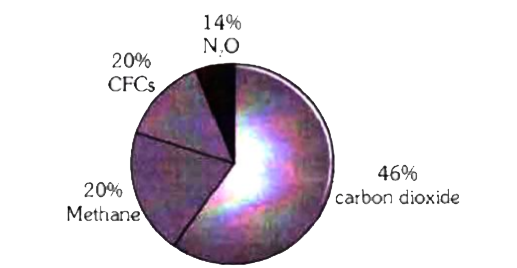
In above diagram find out correct gaseous contribution
View SolutionThe figure is showing relative constibution of various green house gases to total global warming.
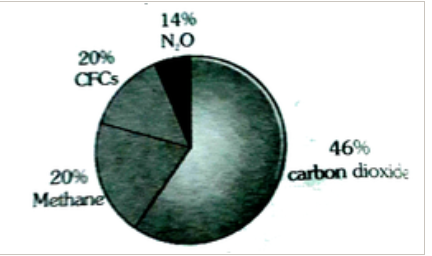
In above diagram find out correct gaseous contributio:-
View SolutionRelative contribution of various green house gases to total global warming is given in the diagrams. Identify the green house gases
View SolutionRelative contribution of various green house gases to total global warming is given in the diagrams. Identify the green house gases

View SolutionSelect the mismatched pairs w.r.t. relative contribution of various green house gases to totral global warming: (a) CFCs - 20% (b) N2O-6% © Carbon dioxide - 60% (d) Methane - 14%
View Solution
