A concept map showing the filtration between glomerulus and Bowman's capsule is given below.
Draw a concept map to show the filtration between uterine wall and placenta.

Text Solution
Concept map shows the filtration process . It is two way filtration process.

|
Topper's Solved these Questions
- HUMAN REPRODUCTION BOOK - NEW JOYTHI PUBLICATIONCHAPTER - HUMAN REPRODUCTION EXERCISE - QUESTIONS FROM EDUMATE
8 Videos
- HUMAN REPRODUCTION BOOK - NEW JOYTHI PUBLICATIONCHAPTER - HUMAN REPRODUCTION EXERCISE - PREVIOUS YEAR HSE QUESTIONS
9 Videos
- HUMAN REPRODUCTION BOOK - NEW JOYTHI PUBLICATIONCHAPTER - HUMAN REPRODUCTION EXERCISE - NCERT TEXT BOOK QUESTIONS(TRUE/FALSE)
12 Videos
- HUMAN HEALTH AND DISEASEBOOK - NEW JOYTHI PUBLICATIONCHAPTER - HUMAN HEALTH AND DISEASEEXERCISE - PREVIOUS YEAR COMPETITIVE EXAM QUESTIONS
28 Videos
- MICROBES IN HUMAN WELFAREBOOK - NEW JOYTHI PUBLICATIONCHAPTER - MICROBES IN HUMAN WELFAREEXERCISE - PREVIOUS YEAR COMPETITIVE EXAM QUESTIONS
5 Videos
Similar Questions
Knowledge Check

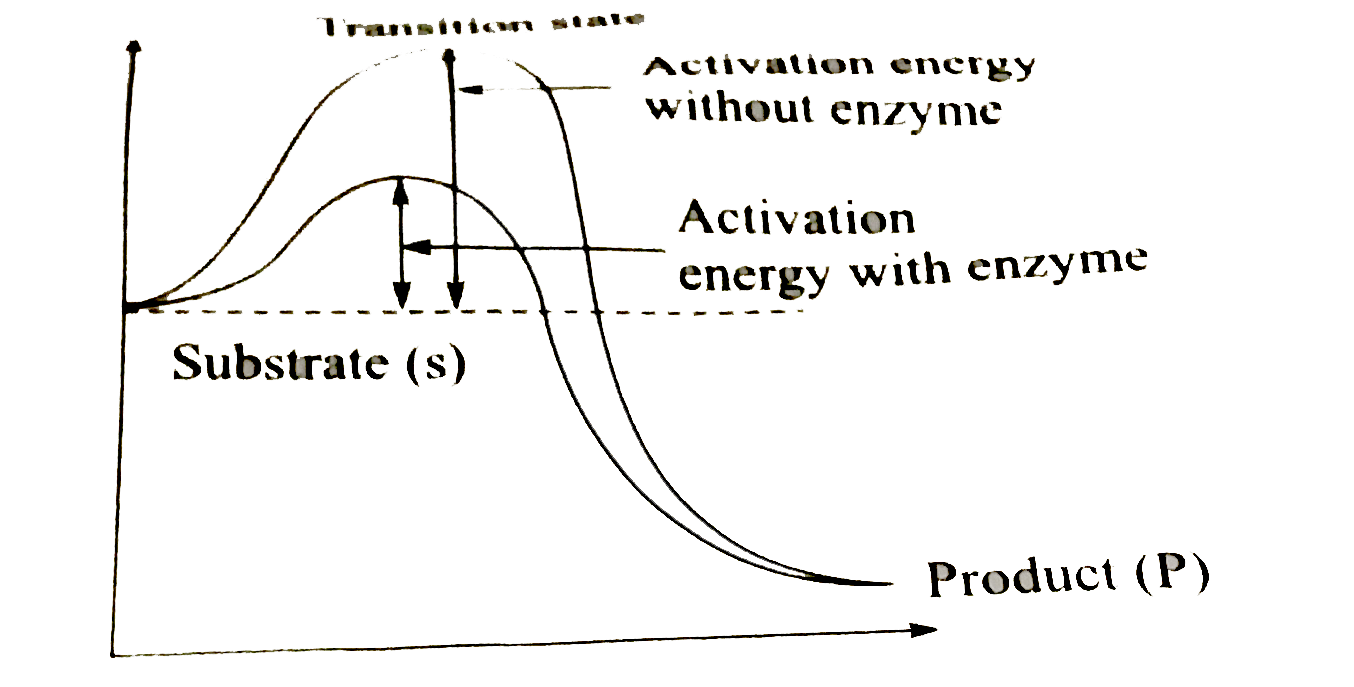
The curve given below shows concept of activation energy. Find out the correct option.Ax-axis represents progress of reaction and y-axis represents potential energy.Bx-axis represents potential energy and y-axis represents progress of reaction.Cx-axis represents transition state and y-axis represents activation energy.Dx-axis represents substrate and y-axis represents production.The curve given below shows concept of activation energy . Find out the correct option .
 Ax-axis represents progress of reaction and y - axis represents potential energy .Bx-axis represents potential energy and y - axis represents progress of reactionCx-axis represents transition state and y - axis represents activation energyDx-axis represents subtrate and y - axis represents product .
Using the following words draw a concept map

View SolutionSketch a concept map to show structure of disaster management authority .
View SolutionDraw neat diagrams to show the difference between linear and cross-linked polymers.
View SolutionFrom the data given below, draw a linear graph showing the relationship between the cost of trousers and the number of trousers.

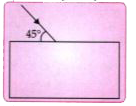
View SolutionDraw the diagram given below and clearly show the path taken by the emergent ray:

View SolutionDraw a simple diagram to show the sedimentation and filtration of water - supply units .
View Solution
