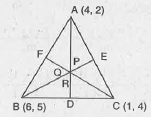
బిందువులు A(1,2), B(6,5) మరియు C(1,4) లు △ABC యొక్క శీర్షాలు.
 A నుండి BC పైకి గీసిన మధ్యగతరేఖ D వద్ద కలుస్తుంది. అయిన D బిందువు నిరూపకాలు కనుగొనండి.
Step by step video & image solution for బిందువులు A(1,2), B(6,5) మరియు C(1,4) లు /_\ABC యొక్క శీర్షాలు. A నుండి BC పైకి గీసిన మధ్యగతరేఖ D వద్ద కలుస్తుంది. అయిన D బిందువు నిరూపకాలు కనుగొనండి. by Maths experts to help you in doubts & scoring excellent marks in Class 10 exams.
Updated on:21/07/2023Topper's Solved these Questions
- నిరూపక రేఖాగణితంBOOK - VGS PUBLICATION-BRILLIANT(TELUGU)CHAPTER - నిరూపక రేఖాగణితంEXERCISE - Exercise
175 Videos
- త్రికోణమితి అనువర్తనాలుBOOK - VGS PUBLICATION-BRILLIANT(TELUGU)CHAPTER - త్రికోణమితి అనువర్తనాలుEXERCISE - Exercise
97 Videos
- బహుపదులుBOOK - VGS PUBLICATION-BRILLIANT(TELUGU)CHAPTER - బహుపదులుEXERCISE - Exercise
245 Videos
Similar Questions
కింద ఇవ్వబడిన బిందువుల మధ్య దూరంను కనుగొనండి. (2,3) మరియు (4,1)
View Solutionభూమన జక టవర్ నిటారుగా నిలిచి ఉంది. అ టవర అడుగు ముంది 15 మీటర్ల దూరదు మంది ఆ టవర్ పె కొన 45∘ ఊర్ధ్వకోణంలో పరిశీలించబడింది. ఆ టవర్ ఎత్తు ఎంత ?
View Solutionp(x)=5x7−6x5+7x−6అయిన కింది వానిని కనుగొనండి. x5 యొక్క గుణకం
View SolutionIn the given figure (not to scale), O is the centre of the circle. A,B,C and D are concyclic and AB=CD . If /_MON =120^(@) , then find /_ OPN .
View SolutionHow many lines of symmetry does the above figure have ?
View SolutionWhich of the following are correct chain isomers of butane ? (i)
View SolutionDetermine the point of symmetry of a regular hexagon.
View SolutionDtermine the images of the following figure about the given line :
View SolutionMatch the following Column A to Column B

View SolutionMatch the following Column A to Column B

View SolutionMatch the following Column A to Column B

View SolutionFind the area of the figure given below.

View SolutionThe area of the shaded part in the figure given below is ______.

View SolutionThe inequation represented by the graph given below is :
View SolutionThe inequation that best describes the graph given below is _________
View SolutionThe inequation that best describes the following graph is _________
View Solution
