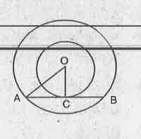
a,b లు (a>b) వ్యాసార్థలుగా గల రెండు ఏక కేంద్ర వృత్తాలలో పెద్ద జ్యా AB చిన్న వృత్తానికి స్పర్శరేఖ అయినచో AB జ్యా పొడవు

2√a2−b2
√a2−b2
2√a2+b2
√a2+b2
Step by step video & image solution for a,b లు (a>b) వ్యాసార్థలుగా గల రెండు ఏక కేంద్ర వృత్తాలలో పెద్ద జ్యా AB చిన్న వృత్తానికి స్పర్శరేఖ అయినచో AB జ్యా పొడవు by Maths experts to help you in doubts & scoring excellent marks in Class 10 exams.
Updated on:21/07/2023Topper's Solved these Questions
- వృత్తాలకు స్పర్శరేఖలు మరియు ఛేదనరేఖలుBOOK - VGS PUBLICATION-BRILLIANT(TELUGU)CHAPTER - వృత్తాలకు స్పర్శరేఖలు మరియు ఛేదనరేఖలుEXERCISE - Exercise
93 Videos
- వాస్తవ సంఖ్యలుBOOK - VGS PUBLICATION-BRILLIANT(TELUGU)CHAPTER - వాస్తవ సంఖ్యలుEXERCISE - Exercise
285 Videos
- సంభావ్యతBOOK - VGS PUBLICATION-BRILLIANT(TELUGU)CHAPTER - సంభావ్యతEXERCISE - Exercise
173 Videos
Similar Questions
కింది ఖాళీలను పూరించండి. వృత్తాన్ని, ఒక స్పర్శరేఖ_____బిందువు వద్ద ఖండిస్తుంది.
View Solutionయూక్లిడ్ భాగహార శేష వీధి ఆధారంగా క్రింది జతల గ. సా. భాను కనుగొనండి. 900 మరియు 270
View Solutionఘటన E యొక్క సంభావ్యత + ఘటన E కాదు సంభావ్యత =..............
View SolutionIn the given figure (not to scale), O is the centre of the circle. A,B,C and D are concyclic and AB=CD . If /_MON =120^(@) , then find /_ OPN .
View SolutionHow many lines of symmetry does the above figure have ?
View SolutionWhich of the following are correct chain isomers of butane ? (i)
View SolutionDetermine the point of symmetry of a regular hexagon.
View SolutionDtermine the images of the following figure about the given line :
View SolutionIn the figure above (not to scale), ¯¯¯¯¯¯AB⊥¯¯¯¯¯¯CDandAD is the bisector of ∠BAE.AB=3cm and AC=5cm. Find CD.
View SolutionMatch the following Column A to Column B

View SolutionMatch the following Column A to Column B

View SolutionMatch the following Column A to Column B

View SolutionThe inequation represented by the graph given below is :
View SolutionThe inequation that best describes the graph given below is _________
View SolutionThe inequation that best describes the following graph is _________
View SolutionWhich inequations represent the shaded region in the given figure
View Solution
