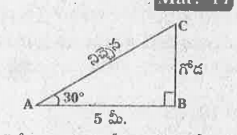
క్రింద ఇవ్వబడిన పటం నుండి నిచ్చెన పొడవు ...........

5మీ.
10మీ.
20మీ.
2.5మీ.
Step by step video & image solution for క్రింద ఇవ్వబడిన పటం నుండి నిచ్చెన పొడవు ........... by Maths experts to help you in doubts & scoring excellent marks in Class 10 exams.
Updated on:21/07/2023Topper's Solved these Questions
- త్రికోణమితి అనువర్తనాలుBOOK - VGS PUBLICATION-BRILLIANT(TELUGU)CHAPTER - త్రికోణమితి అనువర్తనాలుEXERCISE - Exercise
97 Videos
- త్రికోణమితిBOOK - VGS PUBLICATION-BRILLIANT(TELUGU)CHAPTER - త్రికోణమితిEXERCISE - Exercise
299 Videos
- నిరూపక రేఖాగణితంBOOK - VGS PUBLICATION-BRILLIANT(TELUGU)CHAPTER - నిరూపక రేఖాగణితంEXERCISE - Exercise
175 Videos
Similar Questions
భూమన జక టవర్ నిటారుగా నిలిచి ఉంది. అ టవర అడుగు ముంది 15 మీటర్ల దూరదు మంది ఆ టవర్ పె కొన 45∘ ఊర్ధ్వకోణంలో పరిశీలించబడింది. ఆ టవర్ ఎత్తు ఎంత ?
View Solutionఒక లంబకోణ త్రిభుజం ABC లో భుజాలు AB, BC మరియు CA ల పొడవులు వరుసగా 8 సెంమీ, 15 సెంమీ, మరియు 17 సెంమీ అయిన sinA,cosA మరియు tan A ల విలువలు కనుగొనుము.
View Solutionకింద ఇవ్వబడిన బిందువుల మధ్య దూరంను కనుగొనండి. (2,3) మరియు (4,1)
View SolutionHow many lines of symmetry does the above figure have ?
View SolutionWhich of the following are correct chain isomers of butane ? (i)
View SolutionDetermine the point of symmetry of a regular hexagon.
View SolutionDtermine the images of the following figure about the given line :
View SolutionMatch the following Column A to Column B

View SolutionMatch the following Column A to Column B

View SolutionMatch the following Column A to Column B

View SolutionFind the area of the figure given below.

View SolutionThe area of the shaded part in the figure given below is ______.

View SolutionThe inequation represented by the graph given below is :
View SolutionThe inequation that best describes the graph given below is _________
View SolutionThe inequation that best describes the following graph is _________
View SolutionWhich inequations represent the shaded region in the given figure
View Solution
