The heating curve of a particular substance in solid state is as shows in the figure.Choose the correct alternative
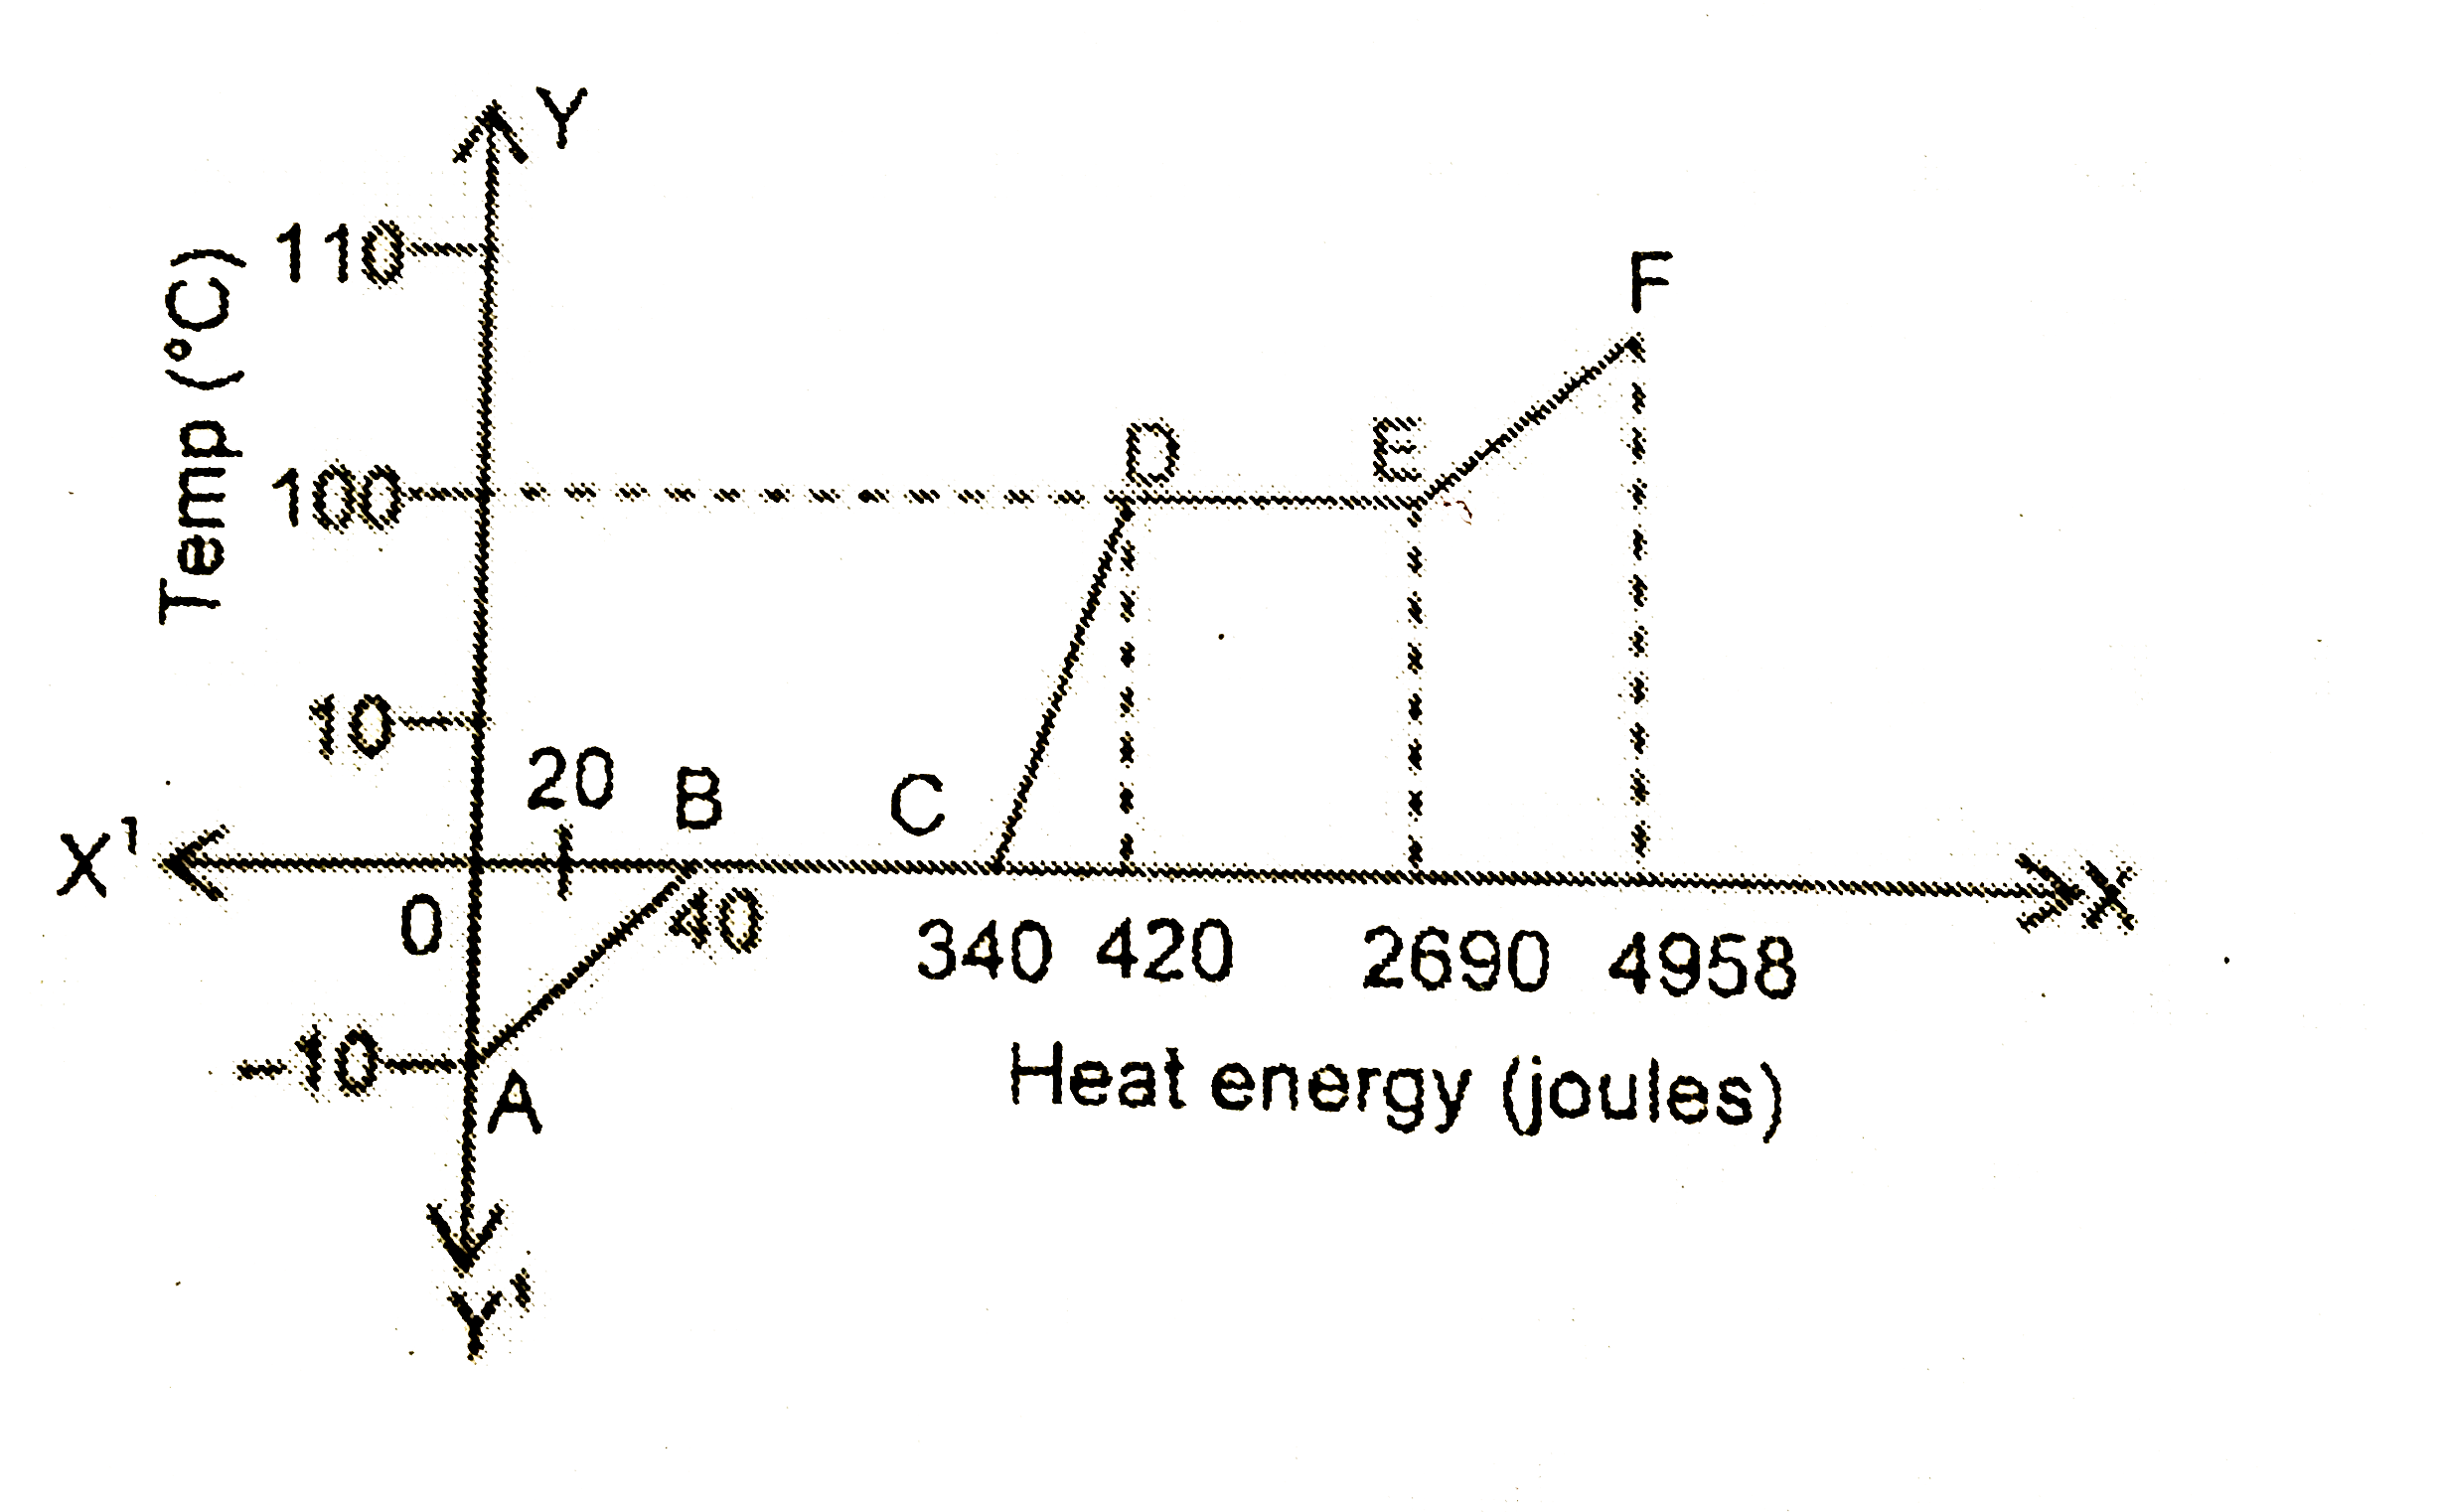
The change of state in the graph is represented by ________part.
ab
bc
de
both b and c
The correct Answer is:d
Step by step video, text & image solution for The heating curve of a particular substance in solid state is as shows in the figure.Choose the correct alternative The change of state in the graph is represented by ________part. by Physics experts to help you in doubts & scoring excellent marks in Class 7 exams.
Updated on:21/07/2023Topper's Solved these Questions
- HEAT BOOK - PEARSON IIT JEE FOUNDATIONCHAPTER - HEAT EXERCISE - Short Answer Type Question
1 Videos
- HEAT BOOK - PEARSON IIT JEE FOUNDATIONCHAPTER - HEAT EXERCISE - Level 1
47 Videos
- HEAT BOOK - PEARSON IIT JEE FOUNDATIONCHAPTER - HEAT EXERCISE - Test 2
14 Videos
- ElectricityBOOK - PEARSON IIT JEE FOUNDATIONCHAPTER - ElectricityEXERCISE - ASSESSMENT TEST (TEST-2)
15 Videos
- KINEMATICSBOOK - PEARSON IIT JEE FOUNDATIONCHAPTER - KINEMATICSEXERCISE - ASSESSMENT TEST (TEST 2 (SELECT THE CORRECT ALTERNATIVE)
15 Videos
Similar Questions
The heating curve of a paritcular substance in solid state is as shown in the figure .choose the correct alternative
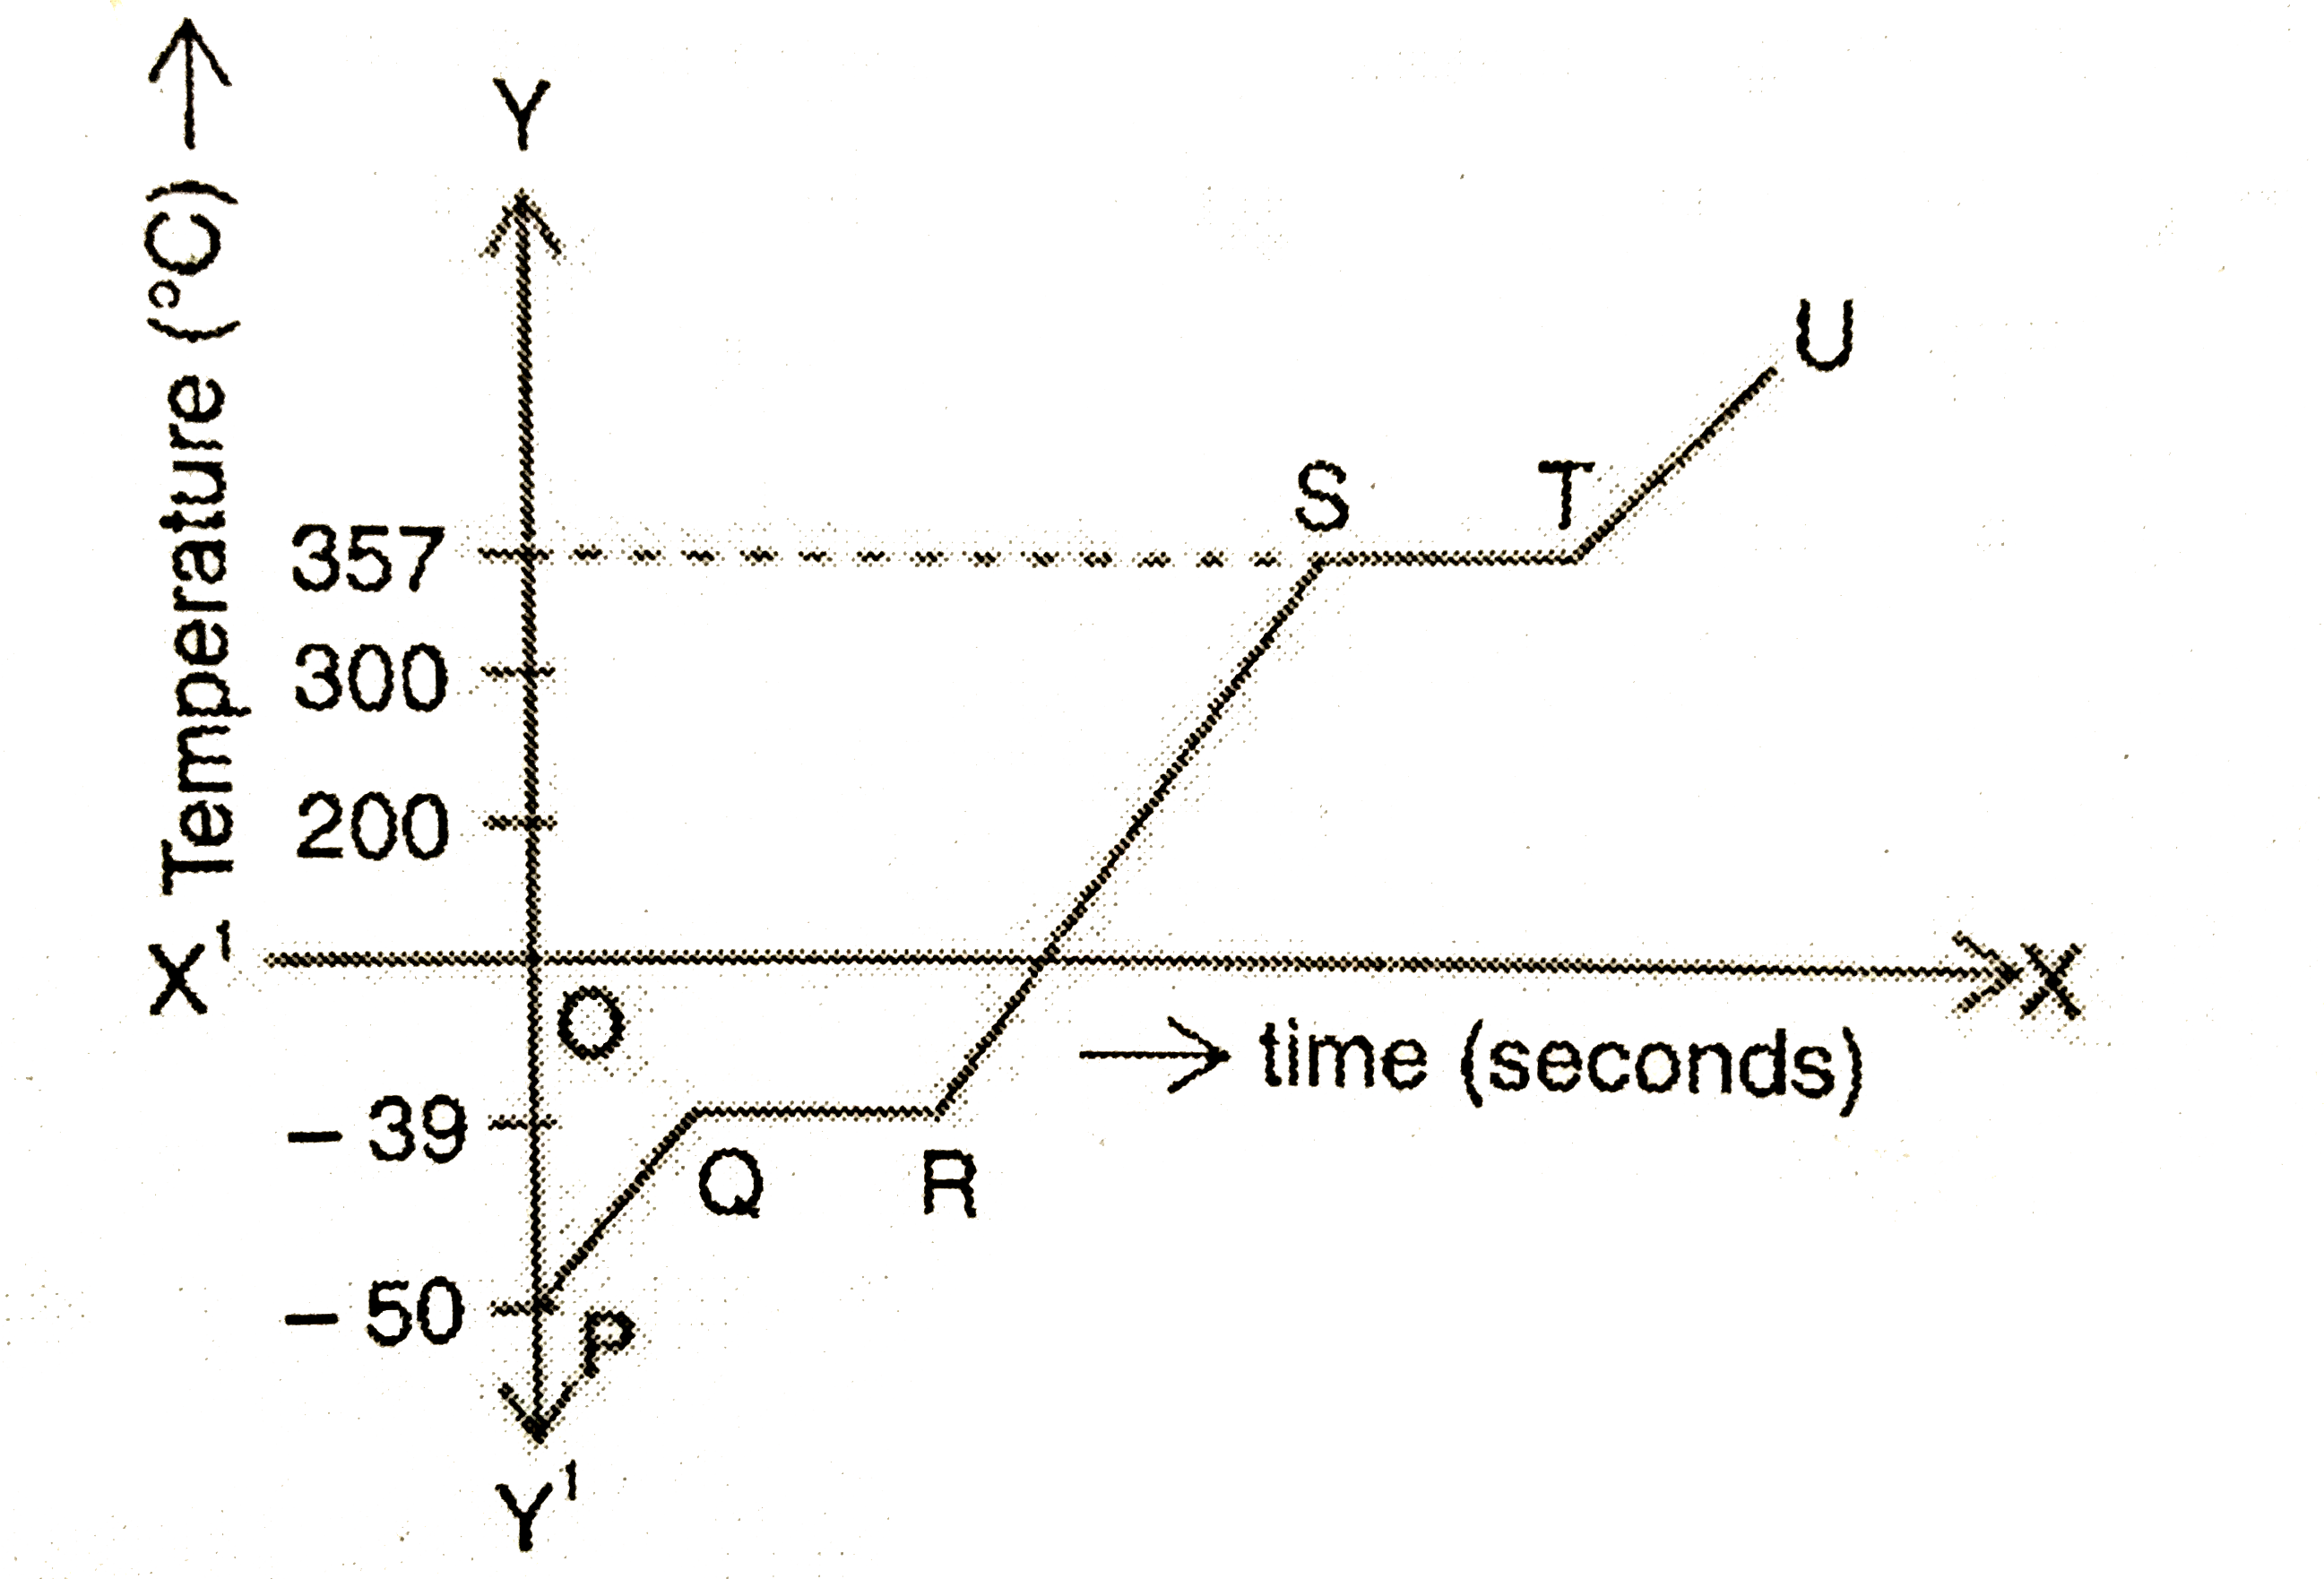
The porition QR of the graph indicates
View SolutionThe heating curve of a paritcular substance in solid state is as shown in the figure .choose the correct alternative

The porition QR of the graph indicates
View Solution
Knowledge Check
The heating curve of a particular substance in solid state is as shown in the figure .choose the correct alternative
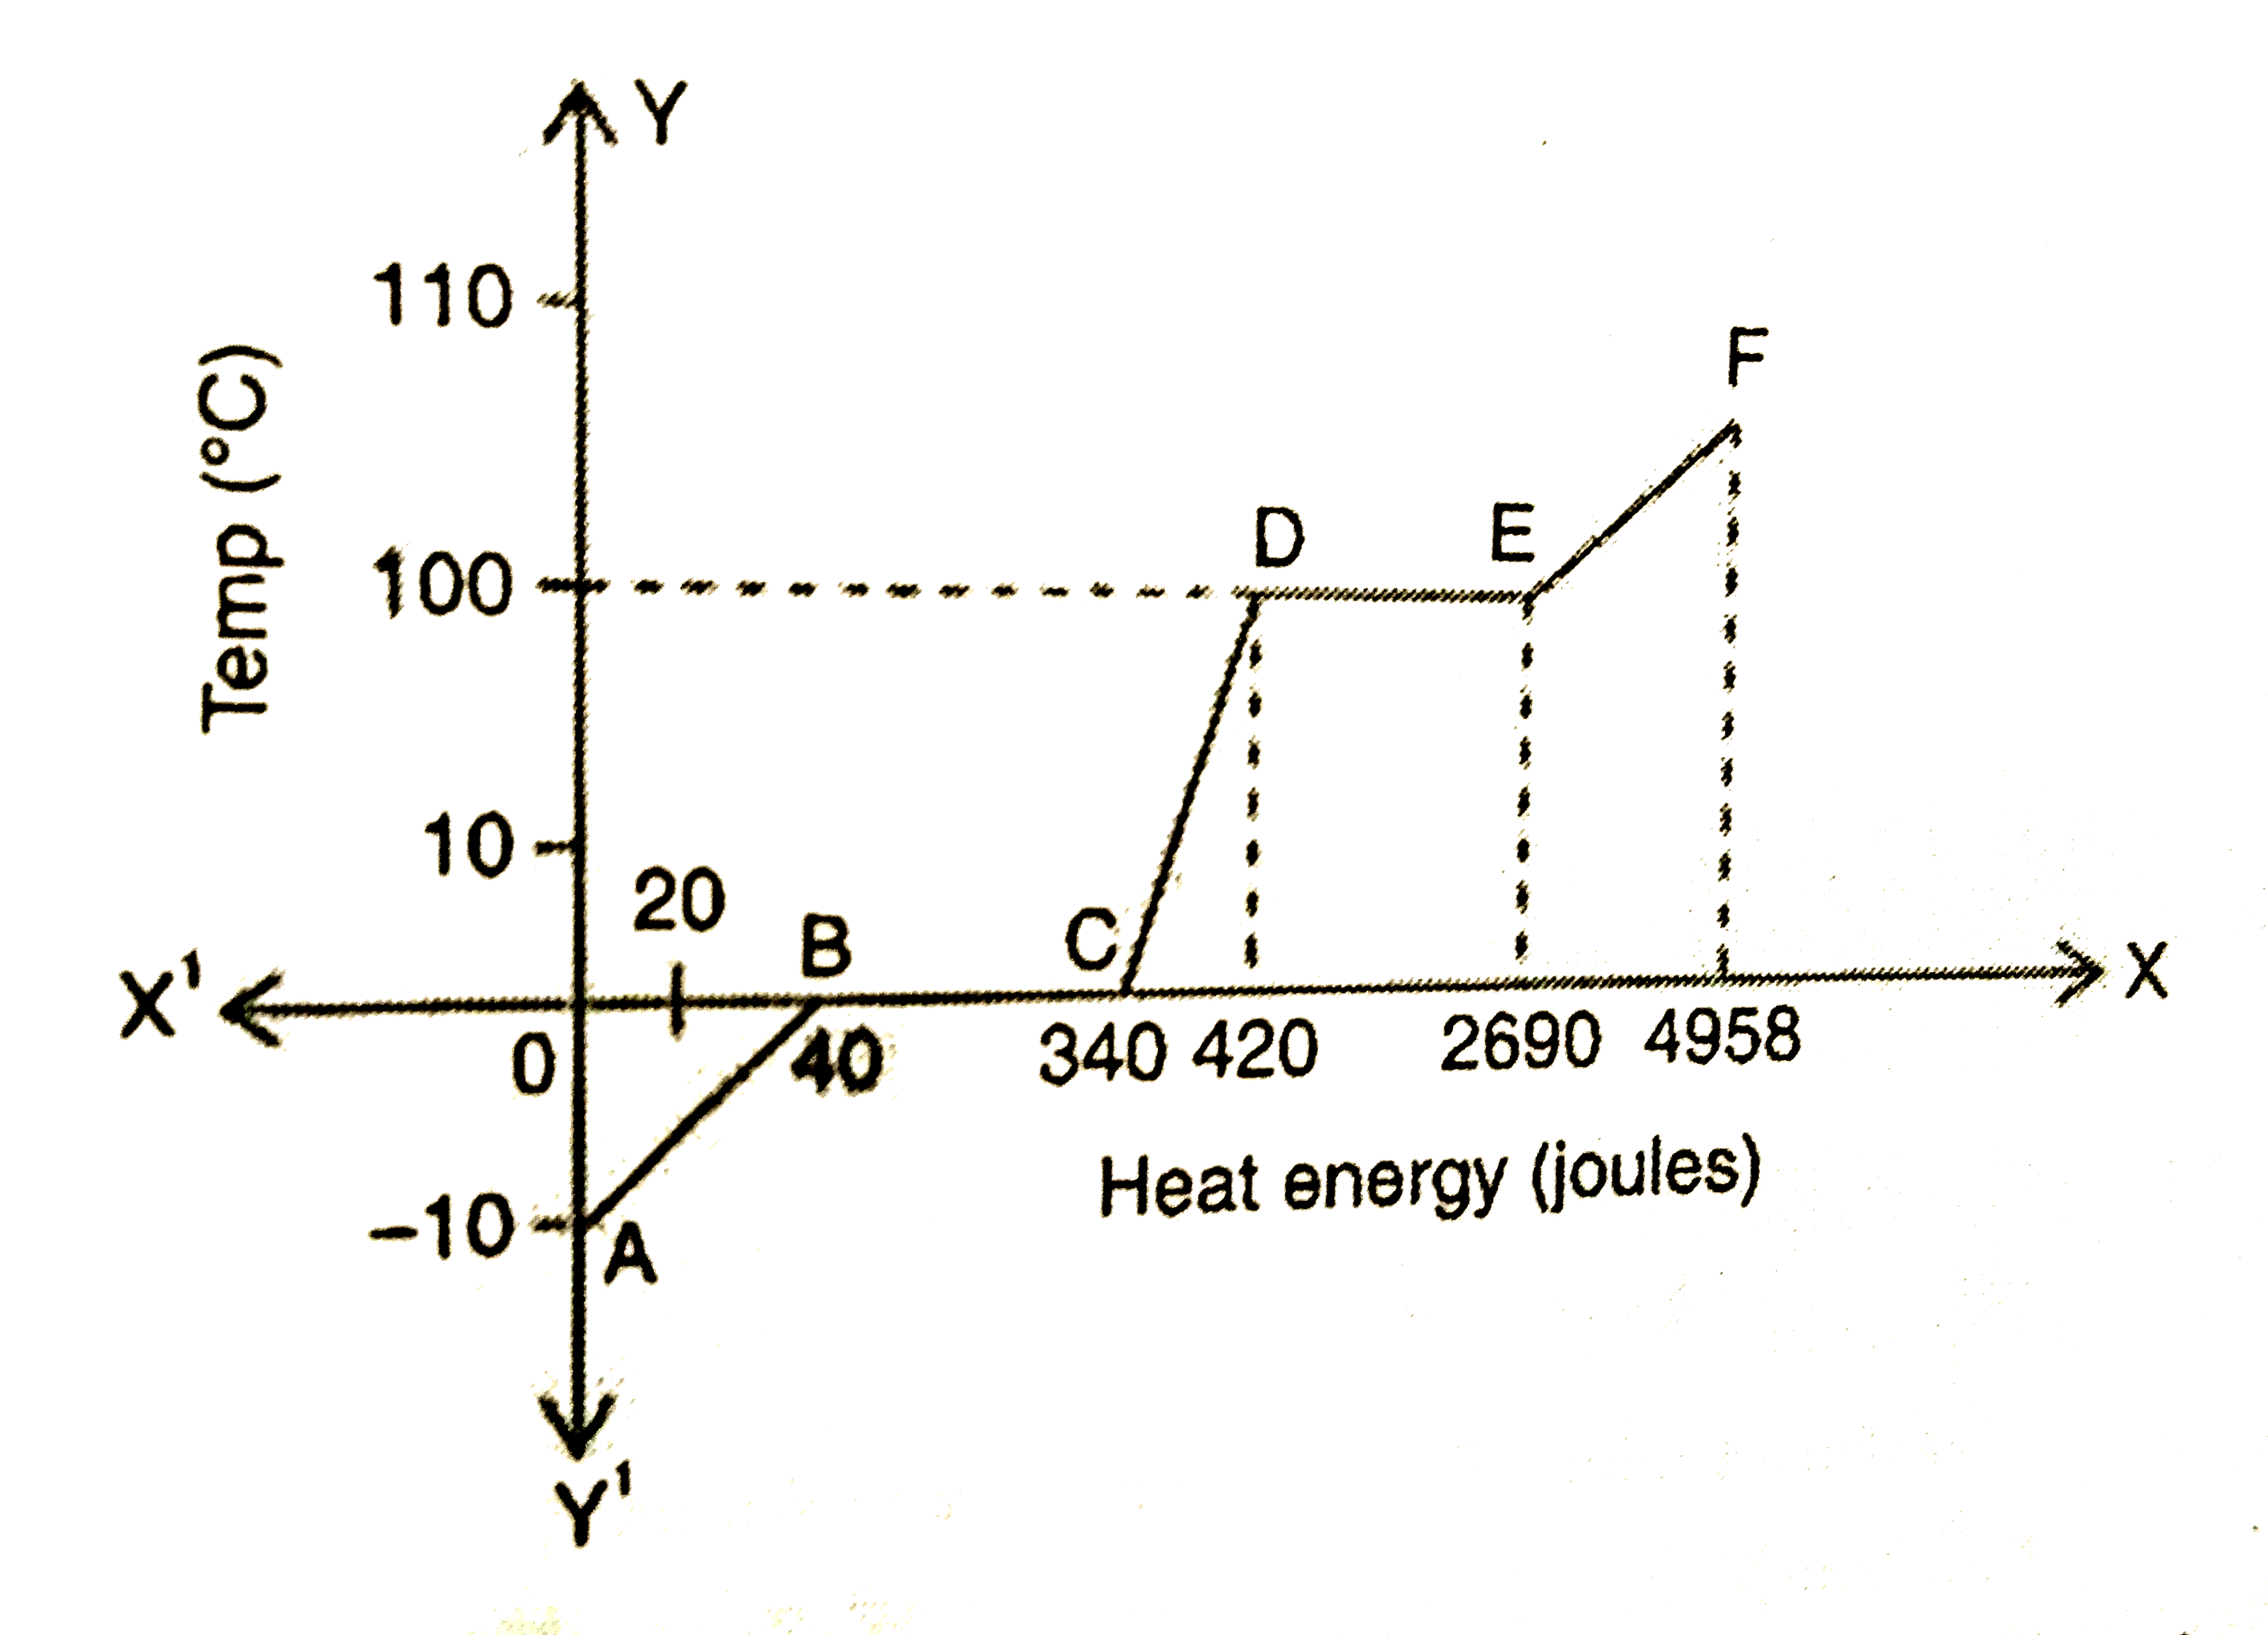
The change of state in the graph is represented by ________part.AabBbcCdeDboth b and cThe heating curve of a particular substance in solid state is as shows in the figure.Choose the correct alternative

The change of state in the graph is represented by ________part.AABBBCCDEDBoth (b) and (c)The heating curve of a particular substance in solid state is as shows in the figure.Choose the correct alternative

The change of state in the graph is represented by ________part.AABBBCCDEDBoth (b) and (c )
The heating curve of a paritcular substance in solid state is as shown in the figure .choose the correct alternative

The porition QR of the graph indicates
View SolutionThe heating curve of a particular substance in solid state is as shown in the figure: Choose the correct alternative.
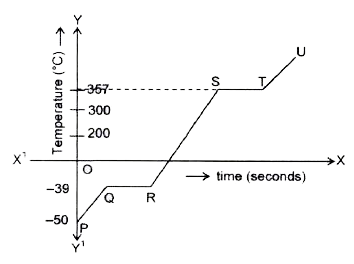
RS part of the graph indicates ___ state of substance.
View SolutionThe heating curve of a particular substance in solid state is as shown in the figure: Choose the correct alternative.
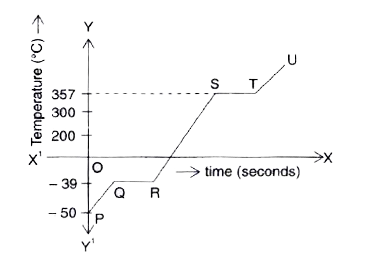
The portion RS of the graph indicates _____ state of substance.
View SolutionThe heating cuve of particular substance in solid state is as shown in the figure : Choose the correct aternativ e
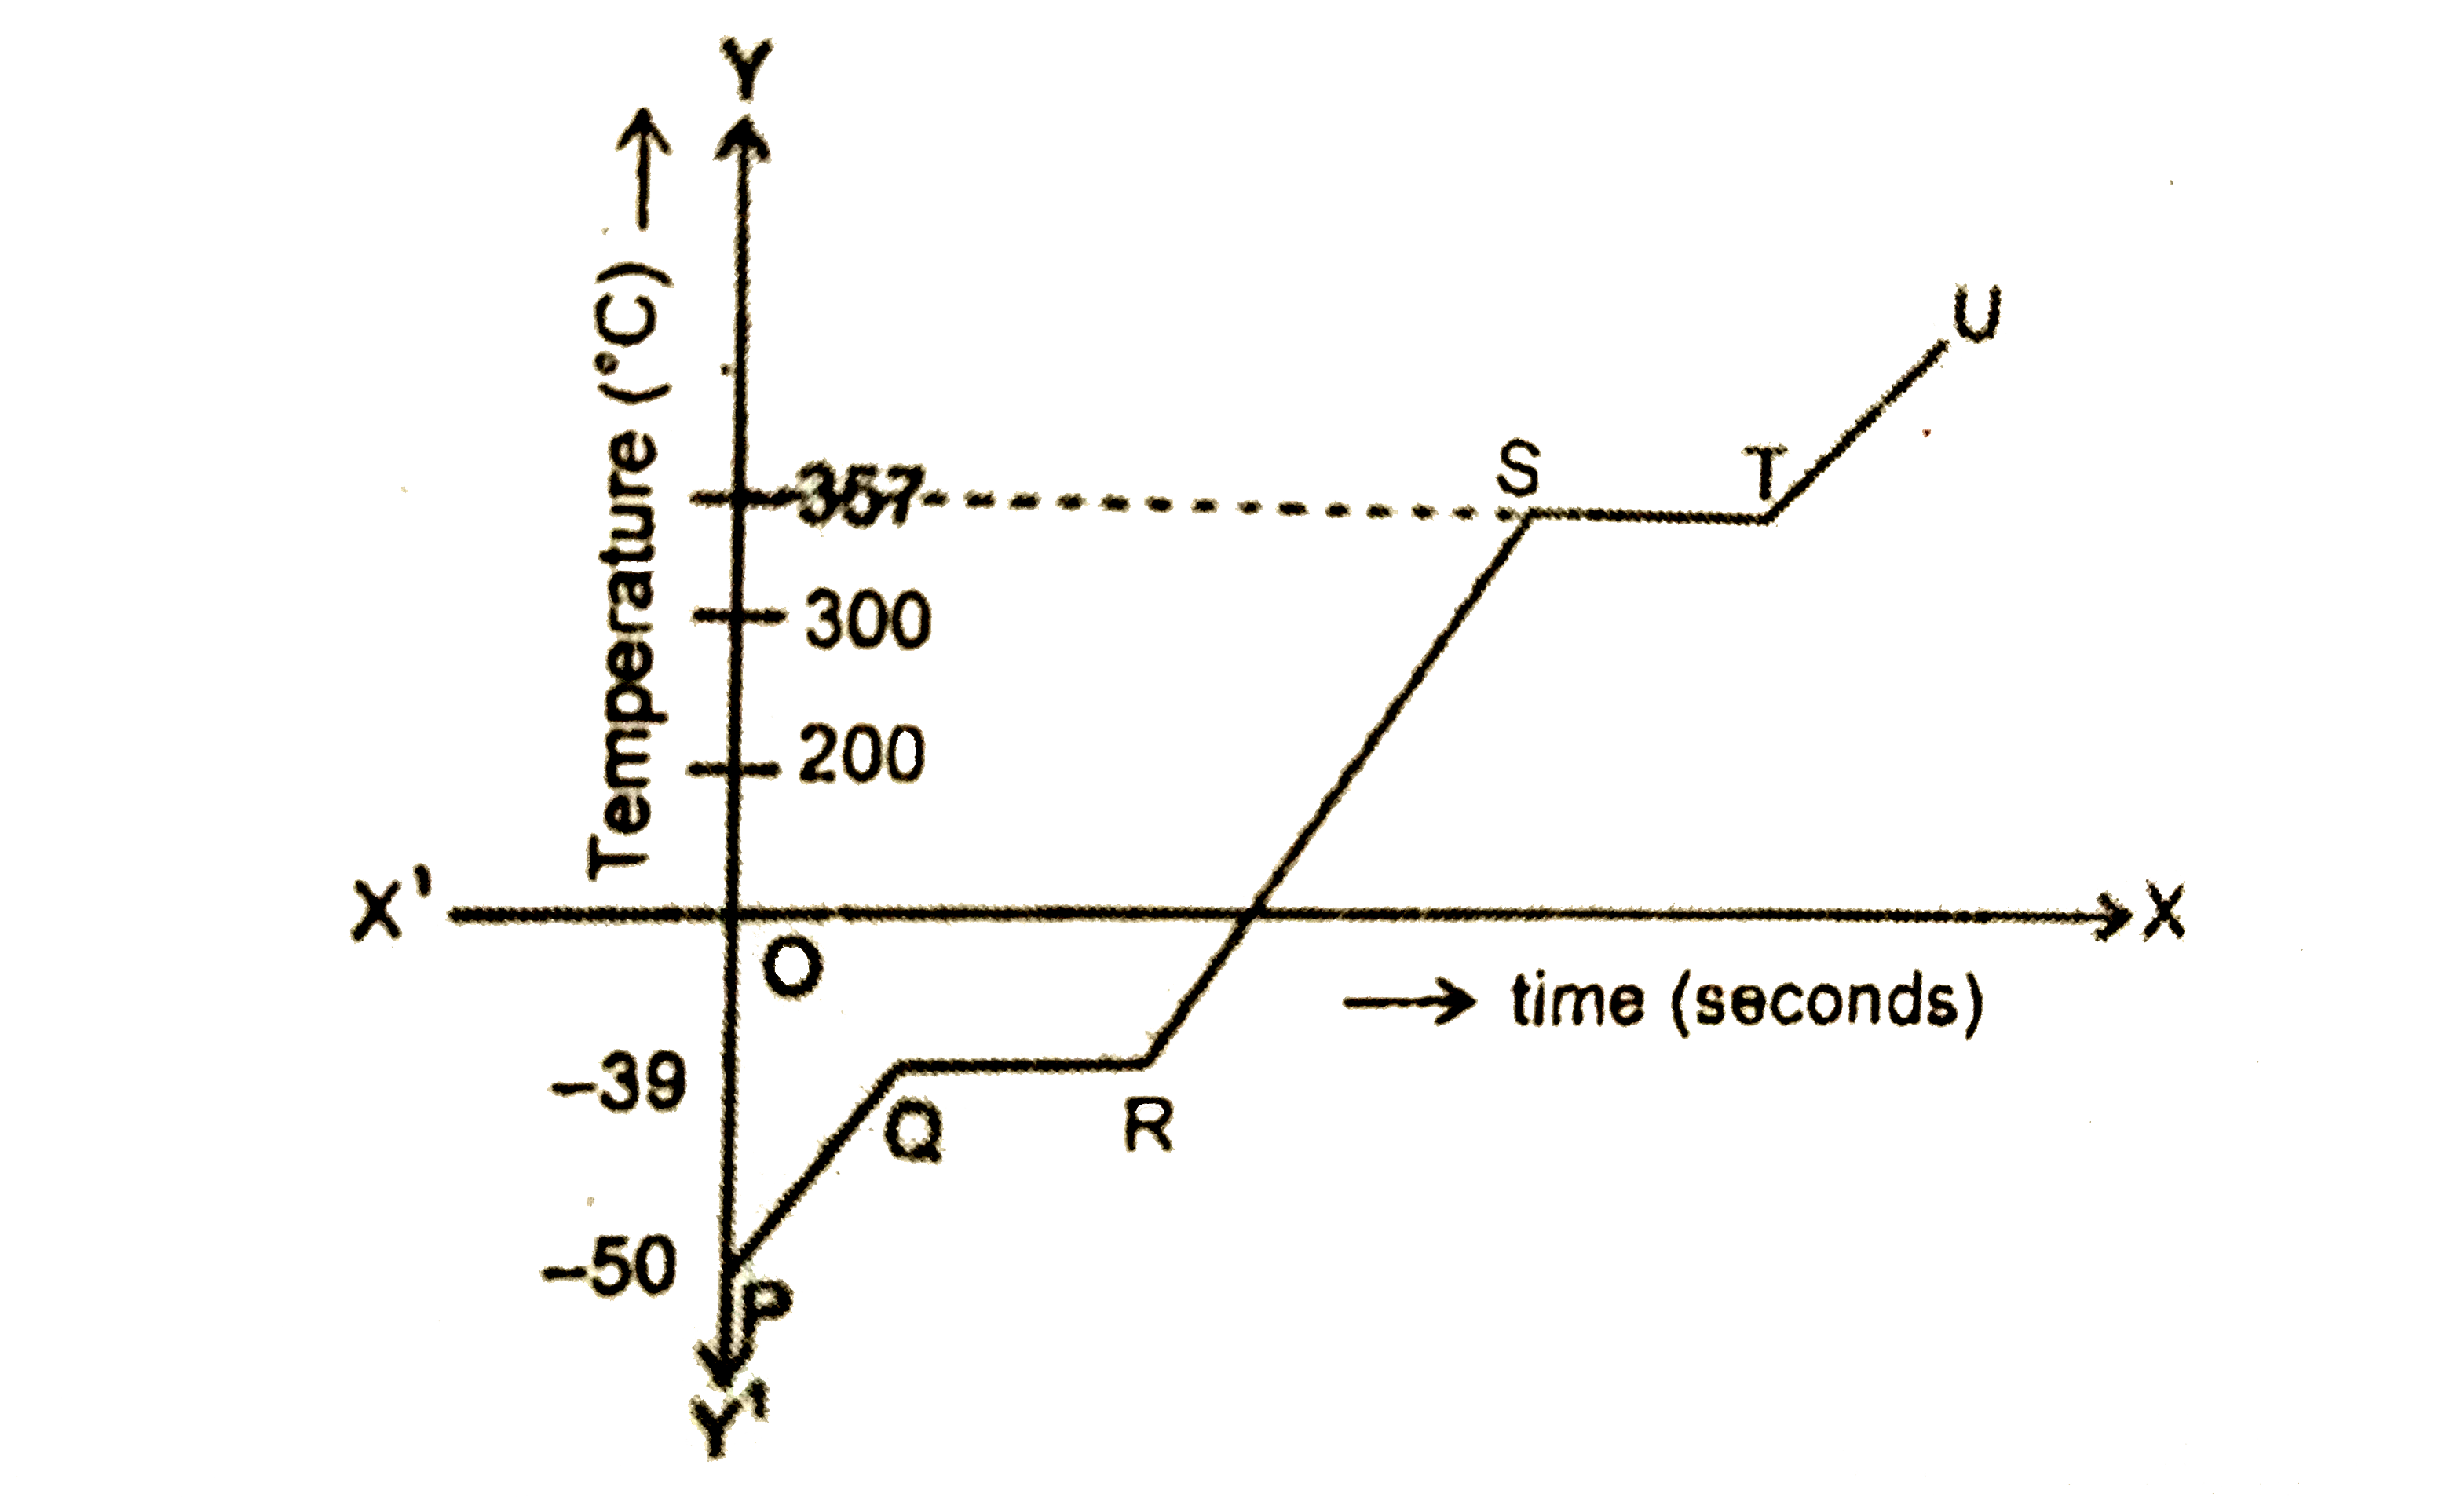 The boiling point of the substance is _________C∘
View SolutionThe heating curve of a particular substance in solid state is as shows in the figure.Choose the correct alternative
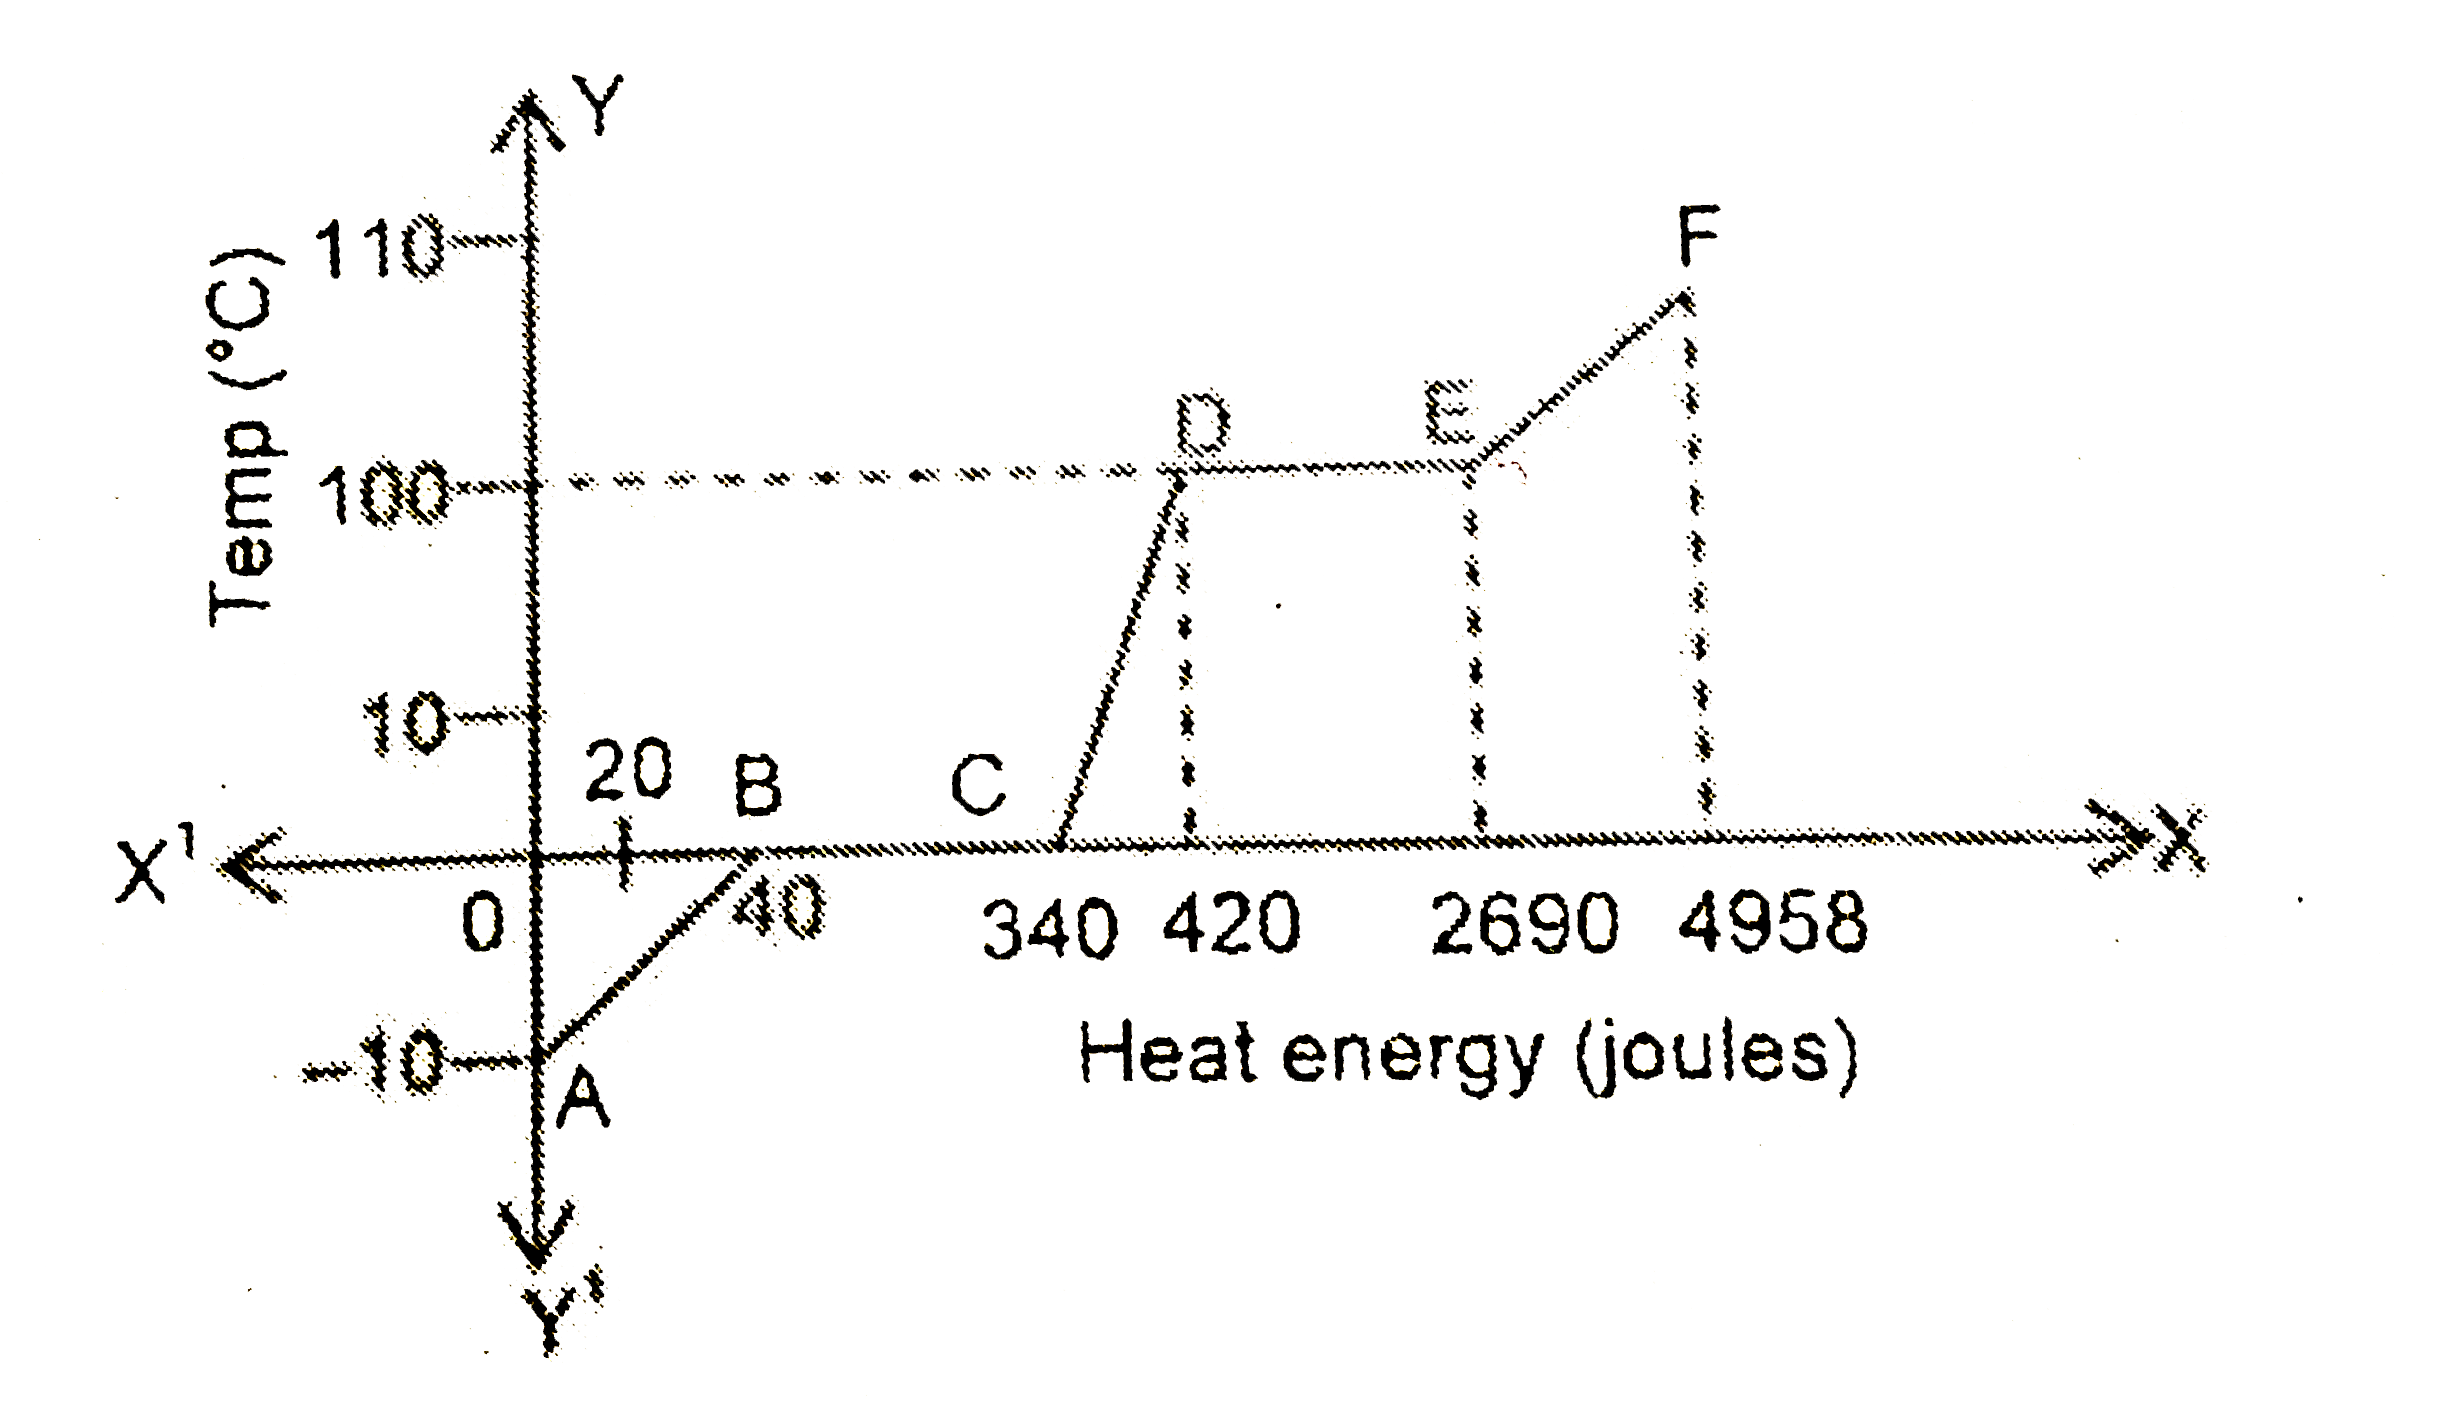
If mass of the substance is 20 g then the heat energy required to melt 1 g the substacne is ______J.
View Solution
