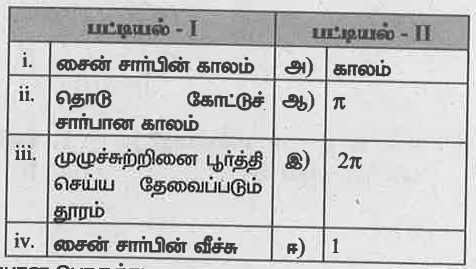
பொருத்துக.

(1) அ ஆ இ ஈ
(2) ஆ இ ஈ அ
(3) இ ஆ அ ஈ
(4) ஈ இ ஆ அ
The correct Answer is:C
Step by step video, text & image solution for பொருத்துக. by Maths experts to help you in doubts & scoring excellent marks in Class 12 exams.
Updated on:21/07/2023Topper's Solved these Questions
- நேர்மாறு முக்கோணவியல் சார்புகள்BOOK - SURA PUBLICATION(TAMIL)CHAPTER - நேர்மாறு முக்கோணவியல் சார்புகள்EXERCISE - EXAMPLE
86 Videos
- நிகழ்தகவு பரவல்கள்BOOK - SURA PUBLICATION(TAMIL)CHAPTER - நிகழ்தகவு பரவல்கள்EXERCISE - EXERCISE
45 Videos
- வகை நுண்கணிதத்தின் பயன்பாடுகள்BOOK - SURA PUBLICATION(TAMIL)CHAPTER - வகை நுண்கணிதத்தின் பயன்பாடுகள்EXERCISE - EXERCISE
134 Videos
Similar Questions
sin−1(cosx),0≤x≤π-ன் மதிப்பு
View SolutionX என்பது மூன்று சீரான நாணயங்களை ஒரே சமயத்தில் ஒரு முறைச் சீண்டும்போது விழும் பூக்களின் எண்ணிக்கை என்க. சமவாய்ப்பு மாறியான X-இன் மதிப்புகளையும் அதன் நேர்மாறு பிம்பங்களில் உள்ள புள்ளிகளின் எண்ணிக்கையையும் காண்க.
View Solutionஆதிப்புள்ளியிலிருந்து t வினாடிகளுக்குப் பிறகு ஒரு துகள் உள்ள தூரத்தின் அளவு s=2t2+3t மீட்டர் எனும்படி நேர்க்கோட்டில் ஒரு துகள் நகர்கிறது. t=3 மற்றும் t = 6 வினாடிகளுக்கிடையே உள்ள சராசரி திசைவேகம் என்ன?
View SolutionHow many lines of symmetry does the above figure have ?
View SolutionWhich of the following are correct chain isomers of butane ? (i)
View SolutionDetermine the point of symmetry of a regular hexagon.
View SolutionDtermine the images of the following figure about the given line :
View SolutionMatch the following Column A to Column B

View SolutionMatch the following Column A to Column B

View SolutionMatch the following Column A to Column B

View SolutionFind the area of the figure given below.

View SolutionThe area of the shaded part in the figure given below is ______.

View SolutionThe inequation represented by the graph given below is :
View SolutionThe inequation that best describes the graph given below is _________
View SolutionThe inequation that best describes the following graph is _________
View SolutionWhich inequations represent the shaded region in the given figure
View Solution
