A railway engine whistiling at a constant frequency moves with a constant speed. It goes past a stationary observer beside the railyway track. Which of the following graphs best represent the variation of frequnecy of the sound (n) heard by the observer with the time (t) ? Solution in Kannada
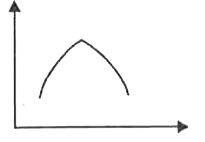
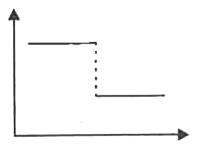
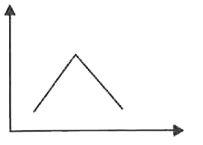
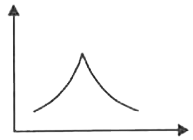
The correct Answer is:B
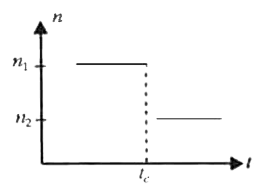
Here the source is moving and the observer is stationary. Also upto time t=tc, the source is approaching the observer, the frequency of sound of the whistle heard then by the observer is given by
n1=n⋅VV−v
and it remains constant upto time tc where the railway engine is crossing the observer. after that the source (engine) recedes away from the observer and the frequency will be given by
n2=VV+v⋅n
where V is the velocity of sound, v is the velocity of the railway engine and n is the actual frequency of the sound of the whistle. there is a sudden change ini the frequency heard by the observer at t=tc and then it remains constant. so there is a discontinuity in the plot of n vs t.
Topper's Solved these Questions
Similar Questions
A balloon starts rising from thee ground with an acceleration of 1.25m/s2. After 8 s, a stone is released from the balloon. The stone will (taking g=10ms−2)
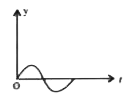
05:35View SolutionThe displacement time graph of a particle executing SHM is as shown in the figure. The corresponding force-time graph of the particle is-
 01:13View Solution
A train whistling at constant frequency is moving towards a station at a constant speed V. The train goes past a stationary observer on the station. The frequency n^(') of the sound as heard by the observer is plotted as a function of time t, figure. Identify the expected curve.
02:26View SolutionAn engine is moving on a circular track with a constant speed. It is blowing a whistle of frequency 500Hz. The frequency received by an observer standing stationary at the centre of the track is
01:54View SolutionA source of frequency 'f' is stationary and an obsercer starts moving towards it at t=0 with constant small acceleration. Then the variation of observed frequency 'f' registered by the observer with time is best represented as
View SolutionA railway engine whistling at a constant frequency moves with a constant speed. It goes past a stationary observer standing beside the railway track. The frequency (n) of the sound heard by the observer is plotted agains time (t) . Which of the following best represents the resulting curve?
05:42View SolutionAn engine whistling at a constant frequency n_(0) and moving with a constant velocity goes past a stationery observer. As the engine crosses him, the frequency of the sound heard by him changes by a factor f. The actual difference in the frequencies of the sound heard by him before and after the engine crosses him is
04:06View SolutionA sound source, emitting sound of constant frequency, moves with a constant speed and crosses a stationary observer. The frequency (n) of sound heard by the observer is plotted against time (t). Which of the following graphs represents the correct variation :-
06:03View SolutionAn engine whistling at a constant frequency n0 and moving with a constant velocity goes past a stationary observer. As the engine crosses him, the frequency of the sound heard by him changes by a factor f. The actual difference in the frequencies of the sound heard by him before and after the engine crosses him is
07:16View SolutionA train whistling at constant frequency 'n' is moving towards a station at a constant speed V. The train goes past a stationary observr on the station . The frequecy 'n' of the sound as heard by the observe is plotted as function of time 't' . Identify the correct curve .
04:48View SolutionA sound source S is moving along a straight track with speed v, and is emitting sound of frequency v_0 (see figure). An observer is standing at a finite distance at the point O, from the track . The time variation of frequency heard by the observer is best respresent by : ( t_0 represents the instant when the distance between the source and observer is minimum )
03:37View SolutionA train whistling at constant frequency is moving towards a station at a constant speed V. The train goes past a stationary observer on the station. The frequency n′ of the sound as heard by the observer is plotted as a function of time t, figure. Identify the expected curve.
04:50View SolutionA sound source S is moving along a straight track with speed v, and is emitting sound of frequency v0 (see figure). An observer is standing at a finite distance at the point O, from the track . The time variation of frequency heard by the observer is best respresent by :
(t0 represents the instant when the distance between the source and observer is minimum )View SolutionA train whistling at constant frequency is moving towards a station at a constant speed V. The train goes past a stationary observer on the station. The frequency n′ of the sound as heard by the observer is plotted as a function of time t, figure. Identify the expected curve.
03:05View SolutionIf the temperature is increased in semi-conductors such that the resistance incessantly falls, it is termed as.
04:53View Solution

