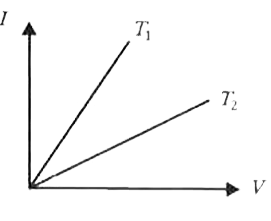
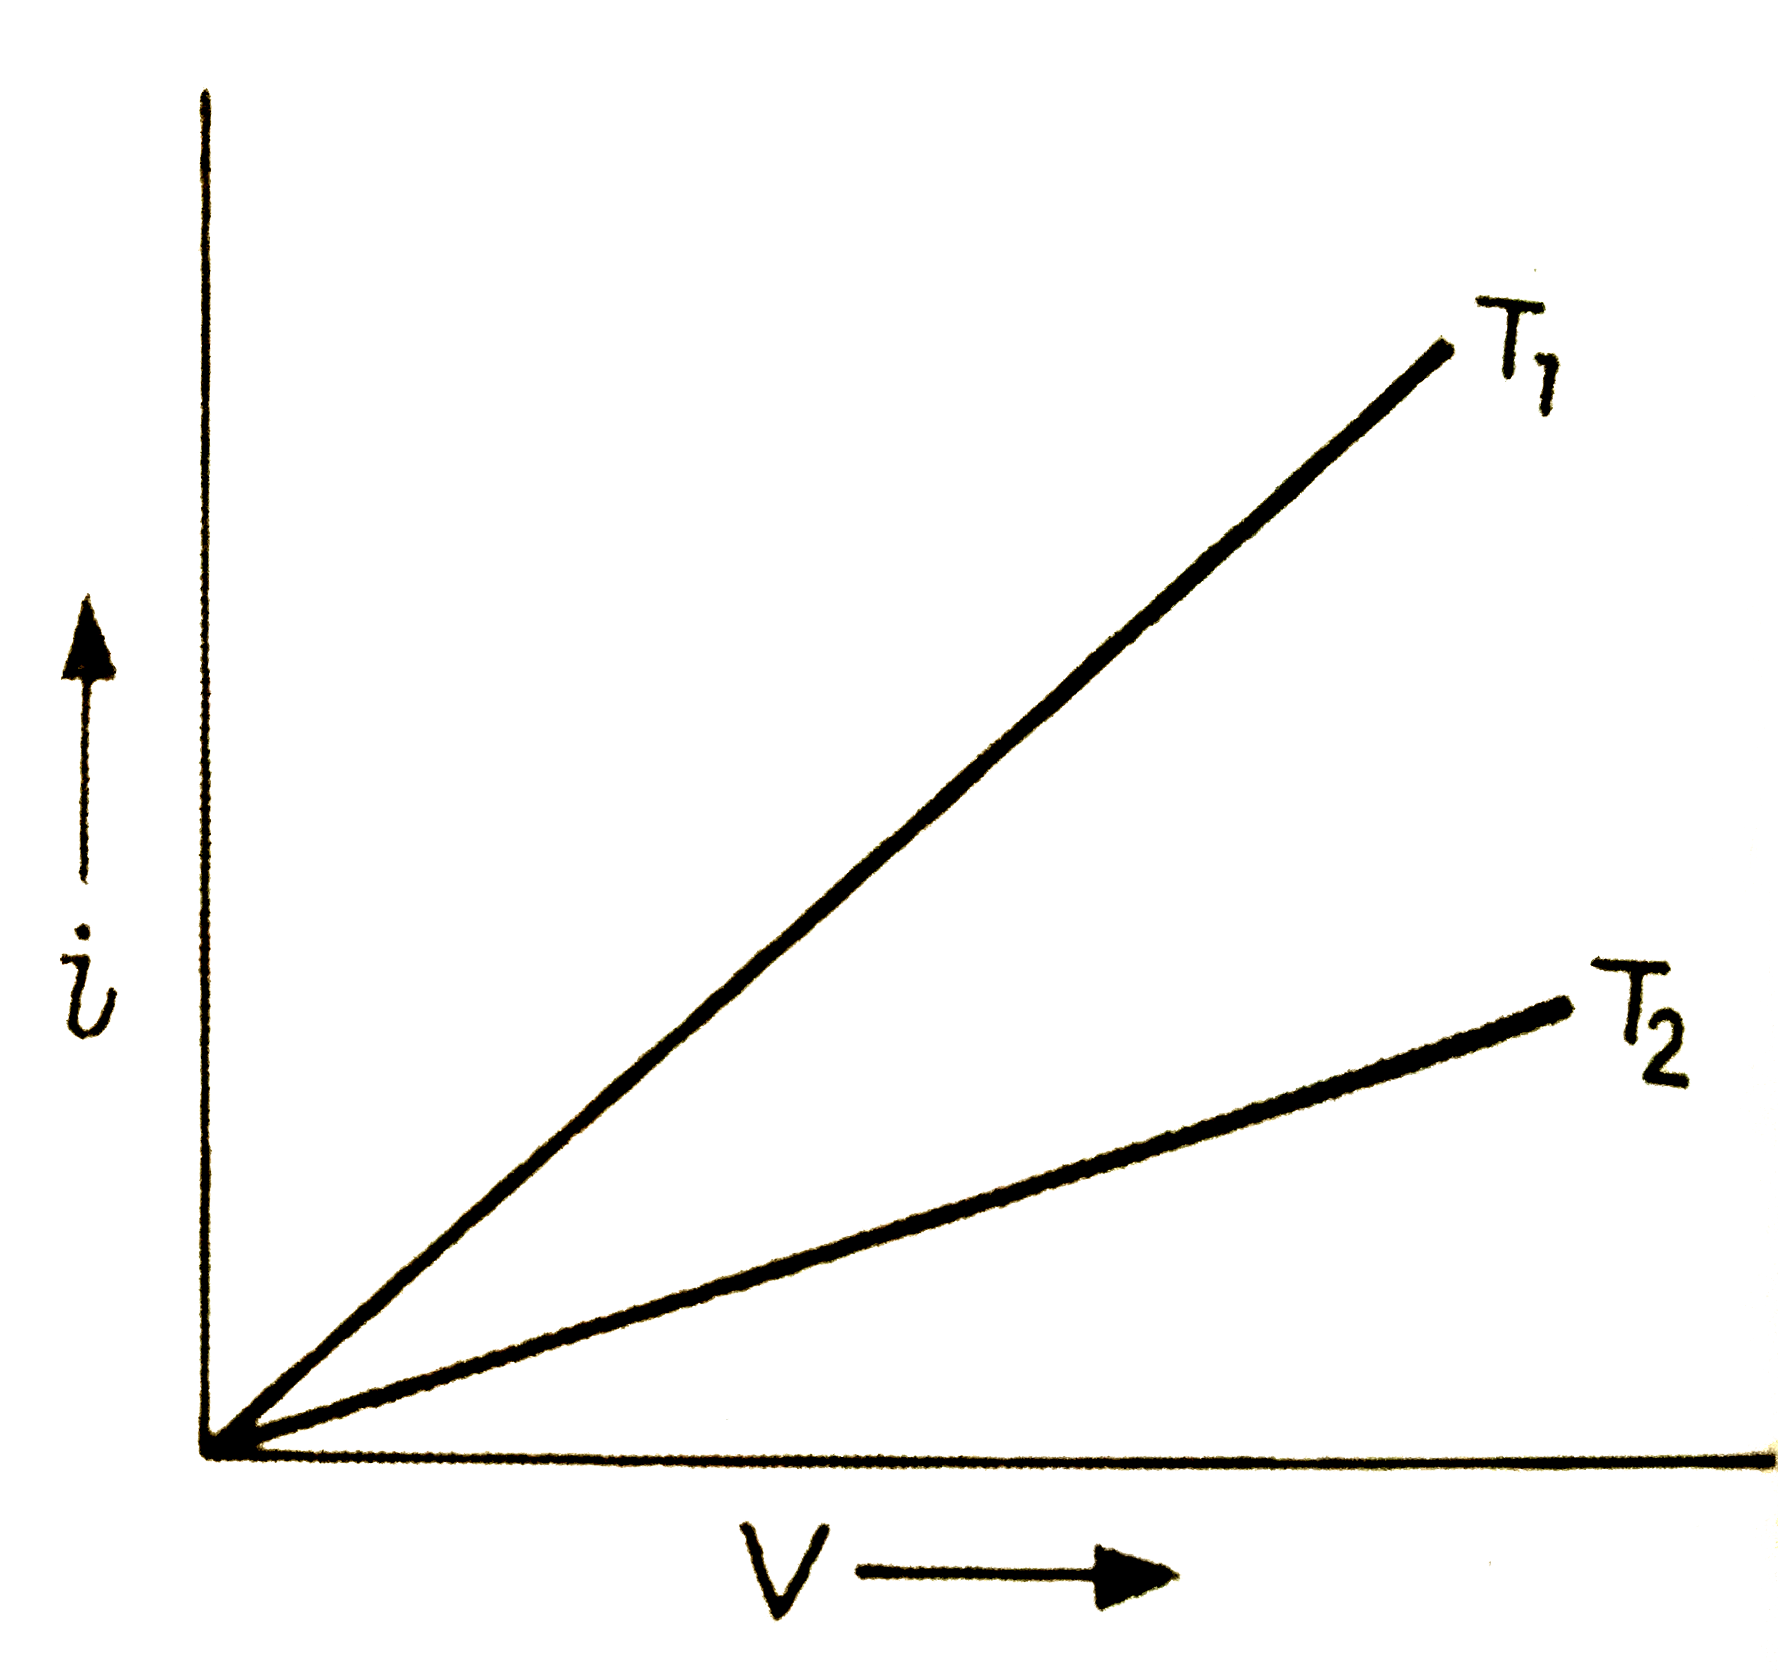
The current-voltage graph for a given metallic conductor at two different temperature T1andT2 are as shown in the figure. Then
 Solution in Kannada
T1<T2
nothing can be said about T1andT2
T1=T2
T1>T2
The correct Answer is:A
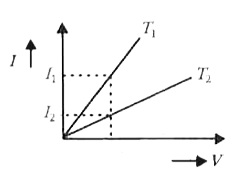
From the figure, it is clear that for the same potential difference current through the conductor at temperature T1 is more than that at the temperature T2.
∴ Also, we know that the resistance of a conductor increases with temperature.
Therefore, T2>T1.
Topper's Solved these Questions
Similar Questions
A balloon starts rising from thee ground with an acceleration of 1.25m/s2. After 8 s, a stone is released from the balloon. The stone will (taking g=10ms−2)
01:13View SolutionThe displacement time graph of a particle executing SHM is as shown in the figure. The corresponding force-time graph of the particle is-
 01:41View Solution
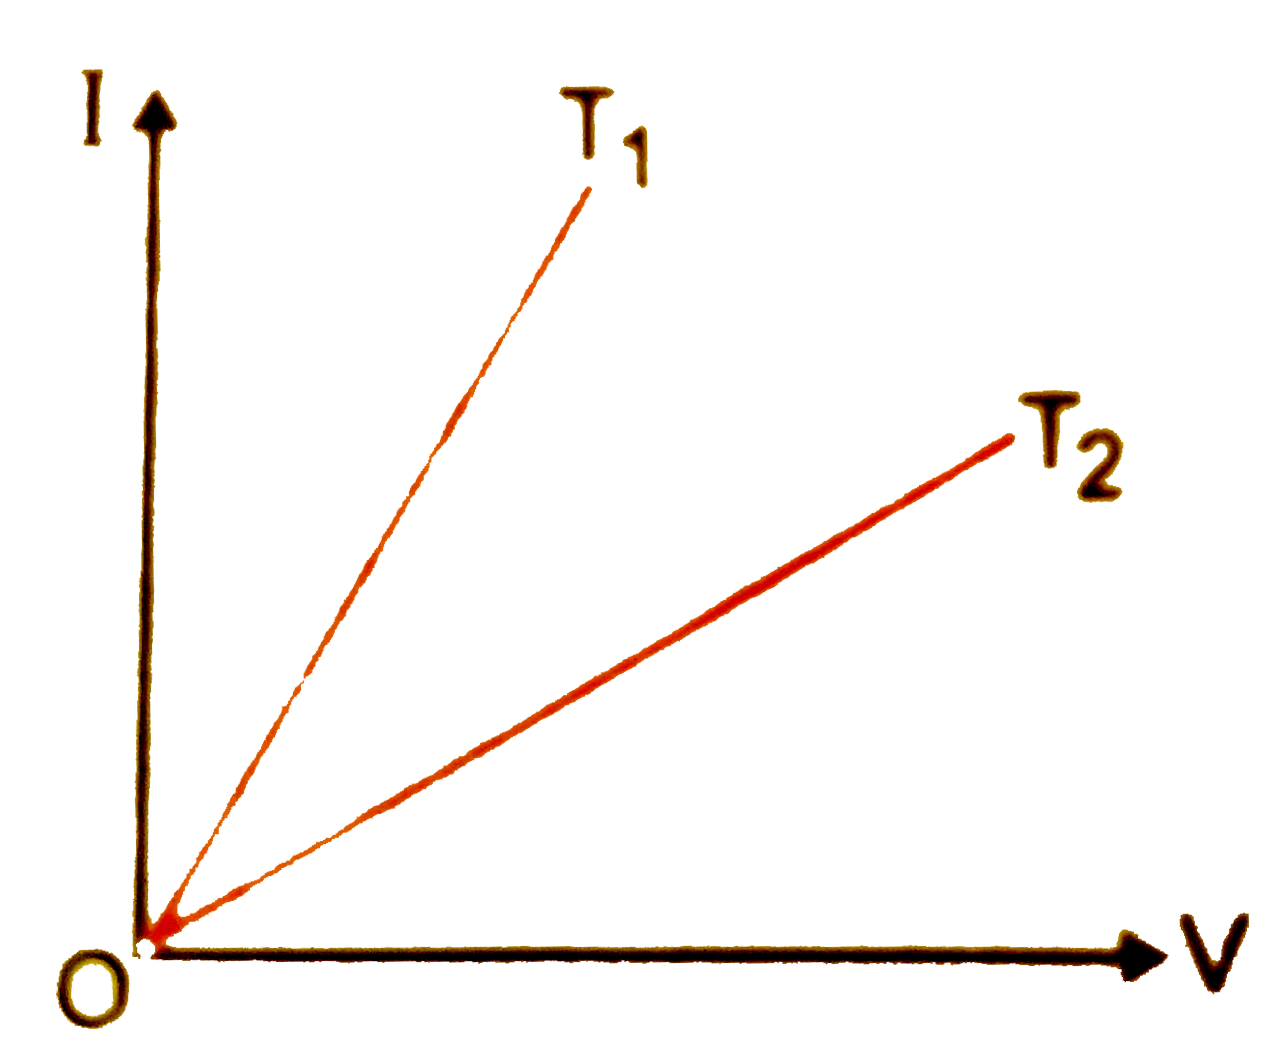
V- I graph for a metallic wire at two different temperature T1 and T2 is shown in figure. Which of the two temperature is higher and why?
 View Solution
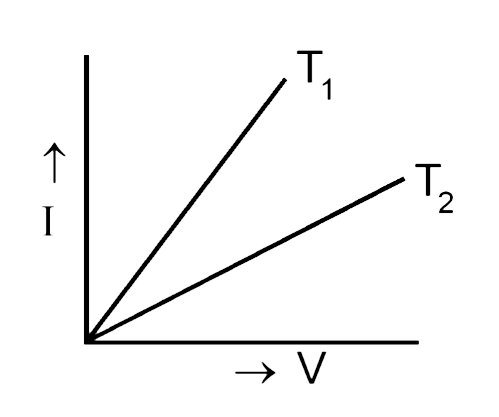
The current (I) and voltage (V) graphs for a given metallic wire at two different temperature (T1) and (T2) are shown in fig. It is concluded that
 03:04View Solution
The voltage V and current I graph for a conductor at two different temperatures T_(1) and T_(2) are shown in the figure. The relation between T_(1) and T_(2) is
01:41View SolutionThe V - i graph for a conductor at temperature T_(1) and T_(2) are as shown in the figure. ( T_(2) - T_(1)) is proportional to
02:01View SolutionThe current (I) and voltage (V) graphs for a given metallic wire at two different temperature (T1) and (T2) are shown in fig. It is concluded that
 01:07View Solution
The voltage V and current I v graphs for a conductor at two different temperatures T1andT2 are shown in the figure. The relation between T1andT2 is
 04:18View Solution
The stress-strain graph for a metallic wire is shown at two different temperature, T_(1) and T_(2) which temperature is high T_(1) or T_(2) ?
03:16View Solutionएक दिये हुए धातु के तार के लिये दो विभिन्न तापों T1 व T2 पर धारा वोल्टेज ग्राफ संलग्न चित्र की भाँति हैं । इनमें कौन - सा ताप अधिक है ?
 04:38View Solution
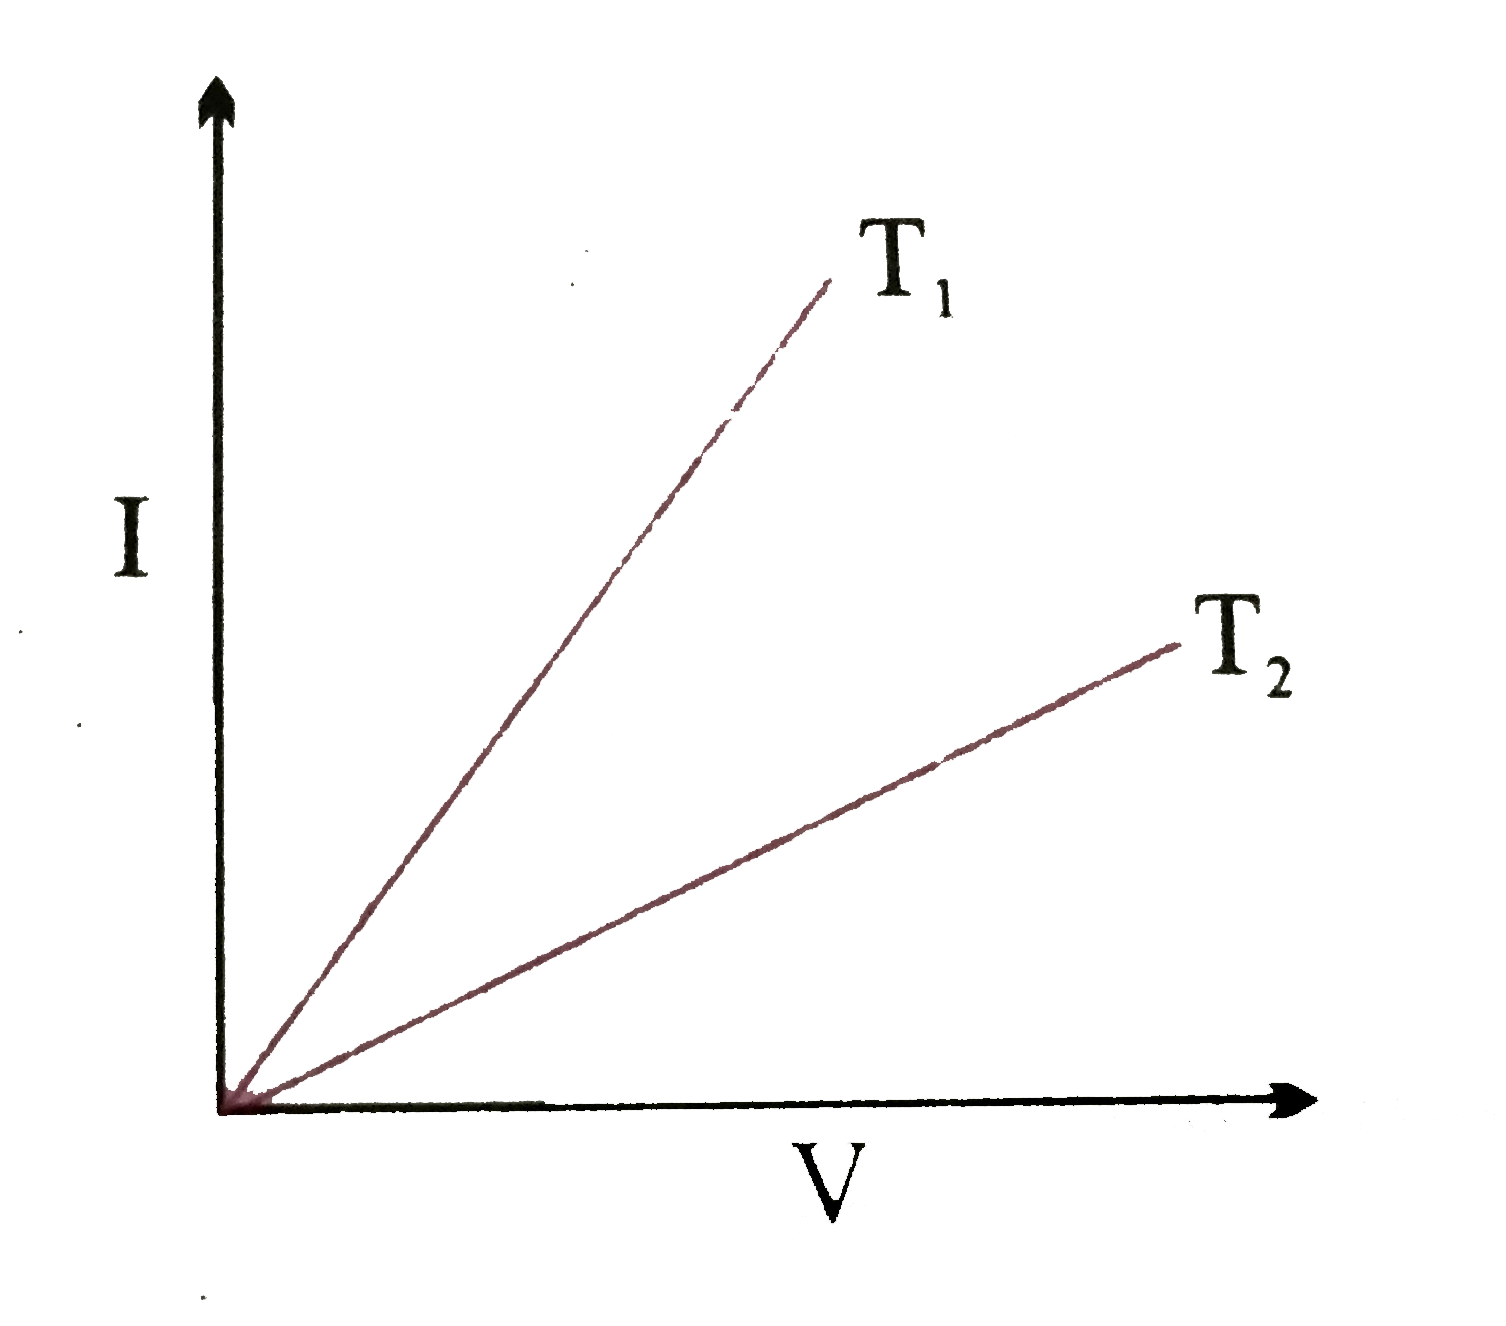
चित्र में विभवांतर V और धारा I के बीच किसी चालक के दो ताप T1और T2 पर ग्राफ दिखाए गये गये है । T1और T2 में सम्बन्ध होगा -
 03:22View Solution
The current-voltage graphs for a given metallic at two difference temperatures T_(1) &T_(2) are shown in figure. The temperature. T_(2) is greater than temperature T_(1) . State whether statement is true or false. Given reason.
03:28View SolutionThe voltage V and current I graphs for a conductor at two different tempratures T_(1) and T_(2) are shown in the figure .The relation between T_(1) and T_(2) is
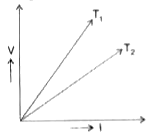
01:56View SolutionThe voltage-current (V-I) graph of a metallic conductor at two different temperatures T1 and T2 is shown below. At which temperature is the resistance higher ?
 01:53View Solution
The voltage V and current I v graphs for a conductor at two different temperatures T1andT2 are shown in the figure. The relation between T1andT2 is
 View Solution

