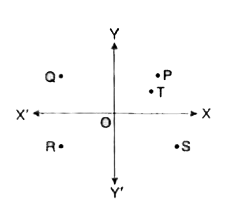
दी गई आकृति में बिन्दुओं P, Q, R, S एवं T के चिन्ह बताएँ।

Step by step video & image solution for दी गई आकृति में बिन्दुओं P, Q, R, S एवं T के चिन्ह बताएँ। by Maths experts to help you in doubts & scoring excellent marks in Class 9 exams.
Updated on:21/07/2023Topper's Solved these Questions
- नियामक ज्यामिति BOOK - ALOK BHARTI PUBLICATIONCHAPTER - नियामक ज्यामिति EXERCISE - साधित उदाहरण
5 Videos
- नियामक ज्यामिति BOOK - ALOK BHARTI PUBLICATIONCHAPTER - नियामक ज्यामिति EXERCISE - प्रश्नावली - 5 (अतिलघु उत्तरीय प्रश्न)
19 Videos
- दो चरों वाले रैखिक समीकरणBOOK - ALOK BHARTI PUBLICATIONCHAPTER - दो चरों वाले रैखिक समीकरणEXERCISE - प्रश्नवाली 4.2 (लघु उत्तरीय प्रश्न)
14 Videos
- प्रायिकताBOOK - ALOK BHARTI PUBLICATIONCHAPTER - प्रायिकताEXERCISE - प्रश्नावली 22 (अतिलघु उत्तरीय प्रश्न)
15 Videos
Similar Questions
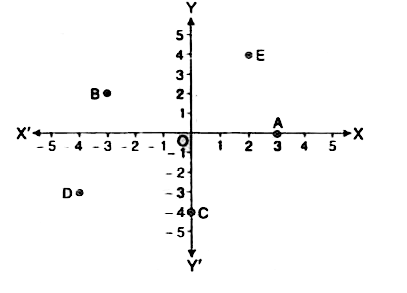
दी गई आकृति में बिन्दुओं A, B, C, D एवं E के निर्देशांक बताएँ।

View Solutionx-अक्ष पर प्रत्येक बिन्दु का y निर्देशांक क्या होता है?
View Solutionनिम्नलिखित समीकरणों के आलेख खींचें।
View Solutionएक सिक्के को 700 बार उछालने पर चित 525 यार एवं पट 175 बार आता है। प्रत्येक घटना की प्रायिकता अभिकलित करें।
View SolutionName the enzymes 'P' and 'Q' that are involved in the processes given below.
ltimg src="https://d10lpgp6xz60nq.cloudfront.net/physics_images/BIO_044_SQP_XII_E01_005_Q01.png" width="80%"gt
View SolutionHow many lines of symmetry does the above figure have ?
View SolutionWhich of the following are correct chain isomers of butane ? (i)
View SolutionDetermine the point of symmetry of a regular hexagon.
View SolutionDtermine the images of the following figure about the given line :
View SolutionMatch the following Column A to Column B

View SolutionMatch the following Column A to Column B

View SolutionMatch the following Column A to Column B

View SolutionFind the area of the figure given below.

View SolutionThe area of the shaded part in the figure given below is ______.

View SolutionThe inequation represented by the graph given below is :
View SolutionThe inequation that best describes the graph given below is _________
View Solution
