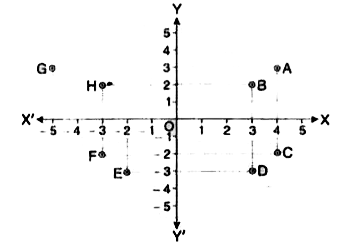
नीचे दी गई आकृति में दिये गए बिन्दुओं के निर्देशांक सकारण लिखे।

The correct Answer is:A(4,3),B(3,2),C(4,−2),D(3,−3),E(−2,−3),F(−3,−2),G(−5,3),H(−3,2)
Step by step video, text & image solution for नीचे दी गई आकृति में दिये गए बिन्दुओं के निर्देशांक सकारण लिखे। by Maths experts to help you in doubts & scoring excellent marks in Class 9 exams.
Topper's Solved these Questions
- BOOK - ALOK BHARTI PUBLICATIONCHAPTER - नियामक ज्यामिति EXERCISE - प्रश्नावली - 5 (दीर्घ उत्तरीय प्रश्न)8videos
नियामक ज्यामिति
- BOOK - ALOK BHARTI PUBLICATIONCHAPTER - नियामक ज्यामिति EXERCISE - प्रश्नावली - 5 (अतिलघु उत्तरीय प्रश्न)19videos
नियामक ज्यामिति
- BOOK - ALOK BHARTI PUBLICATIONCHAPTER - दो चरों वाले रैखिक समीकरणEXERCISE - प्रश्नवाली 4.2 (लघु उत्तरीय प्रश्न)14videos
दो चरों वाले रैखिक समीकरण
- BOOK - ALOK BHARTI PUBLICATIONCHAPTER - प्रायिकताEXERCISE - प्रश्नावली 22 (अतिलघु उत्तरीय प्रश्न)15videos
प्रायिकता
Similar Questions
कार्तीय तल में स्केल 1 सेमी = 2 इकाई लेते हुए निम्नलिखित बिन्दुओं को निरूपित करे।
(i) A(−5,4) (ii) B(4,−3) (iii) C(−3,−5)
(iv) D(3,−4) (v) E(5,6) (vi) F(3,0)
(vii) G(0,−5) (viii) H(0,5) (ix) I(−4,0)
(x) J(0,0)01:37View Solutionx-अक्ष पर प्रत्येक बिन्दु का y निर्देशांक क्या होता है?
06:07View Solutionनिम्नलिखित समीकरणों के आलेख खींचें।
02:11View Solutionएक सिक्के को 700 बार उछालने पर चित 525 यार एवं पट 175 बार आता है। प्रत्येक घटना की प्रायिकता अभिकलित करें।
01:31View SolutionHow many lines of symmetry does the above figure have ?
02:45View SolutionWhich of the following are correct chain isomers of butane ? (i)
02:17View SolutionDetermine the point of symmetry of a regular hexagon.
05:41View SolutionDtermine the images of the following figure about the given line :
02:21View SolutionMatch the following Column A to Column B
 02:03View Solution
Match the following Column A to Column B
 02:10View Solution
Match the following Column A to Column B
 02:17View Solution
Find the area of the figure given below.
 02:10View Solution
The area of the shaded part in the figure given below is ______.
 04:23View Solution
The inequation represented by the graph given below is :
01:13View SolutionThe inequation that best describes the graph given below is _________
03:12View SolutionThe inequation that best describes the following graph is _________
05:46View Solution

