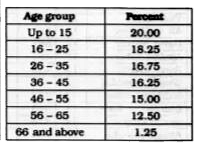
A table showing the percentage of the total population of a State by age groups for the year 1991 is given below. Answer the questions given below it.
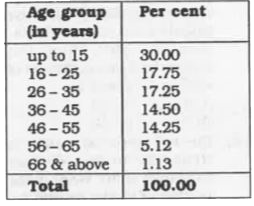
Which age group accounts for the maximum population in the State ?
16 - 25
26 - 35
36-45
56 - 65
The correct Answer is:A
Step by step video & image solution for A table showing the percentage of the total population of a State by age groups for the year 1991 is given below. Answer the questions given below it. Which age group accounts for the maximum population in the State ? by Maths experts to help you in doubts & scoring excellent marks in Class 14 exams.
Updated on:21/07/2023Similar Questions
A table showing the percentage of the total population of a State by age groups for the year 1991 is given below. Answer the questions given below it.
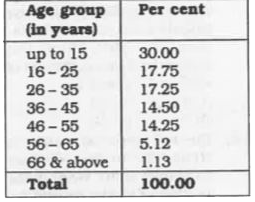
If there are 10 millions people in the age group 56 years and above, what is the difference between the numbers of people in the age groups 16-25 and 46-55?
View SolutionWhich age group forms the working population?
View Solution
Knowledge Check
A table showing the percentage of the total population of a State by age groups for the year 1991 is given below. Answer the questions given below it.
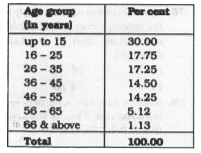
If the difference between the number of people in the age groups (46 - 55) and (26 - 35) is 11.75 millions, then the total population of the State is approximately :A36.23 millionsB391.67 millionsC400 millionsD460.67 millionsA table showing the percentage of the total population of a State by age groups for the year 1991 is given below. Answer the questions given below it.
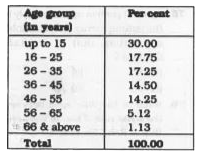
Out of every 4200 persons, the number of persons below 26 years is :A2006 approx.B1260 approx.C746 approx.D515 approx.A table showing the percentage of the total population of a State by age groups for the year 1991 is given below. Answer the questions given below it.
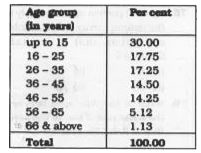
If there are 10 millions people in the age group 56 years and above, what is the difference between the number of people in the age group 16 - 25 and 46 - 55 ?A6.8 millionsB5.6 millionsC28.4 millionsD34.7 millions
A table showing the percentage of the total population of a State by age groups for the year 1991 is given below. Answer the questions given below it.
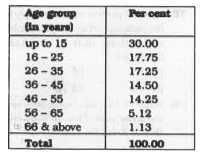
There are 200 million prople below 36 years. How many millions (approx.) people are in the age group 56 - 65 ?
View SolutionObserve the histogram and answer the questions given below.
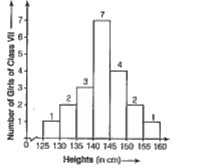
Which group contains maximum
View SolutionThe following table showing the percentage of the total population of a state in different age groups. Out of every 50,000 people, find the approximate number of persons below the age of 35?
निम्नलिखित तालिका एक राज्य में अलग-अलग आयु वर्ग की कुल आबादी के प्रतिशत को दर्शाती है |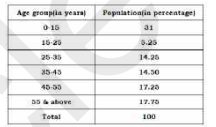
प्रत्येक 50,000 लोगों में से, 35 वर्ष से कम उम्र के लोगों की संख्या (लगभग) ज्ञात करें |
View SolutionThe table shows the percentage of total population of a city in different age groups. Study the table and answer the questions.
If there are 22 million people below 26 years, then the number of people (in millions) in the age group (56 - 65) is
View SolutionThe table shows the percentage of total population of a city in different age groups. Study the table and answer the questions.
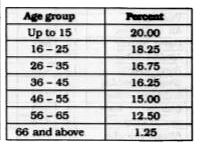
If the difference between the number of people in the age groups (46 - 55) and (16 - 25) is 0.975 million, then the total population (in millions) of the city is
View Solution
