Study then following bar graph carefully and answer the questions.
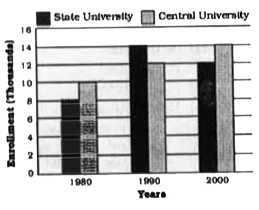
Total enrollments in both State University and Central University during the year 1980,1990 and 2000 is
a) 80000
b) 66000
c) 70000
d) 76000
The correct Answer is:C
Step by step video & image solution for Study then following bar graph carefully and answer the questions. Total enrollments in both State University and Central University during the year 1980,1990 and 2000 is by Maths experts to help you in doubts & scoring excellent marks in Class 14 exams.
Updated on:21/07/2023Similar Questions
Study then following bar graph carefully and answer the questions.
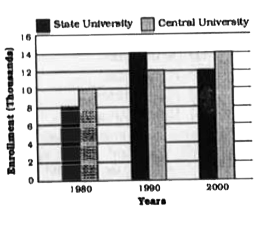
In1990,how many more students were enrolled at state university than at Central University
View SolutionStudy the following graph carefully and answer the given questions.
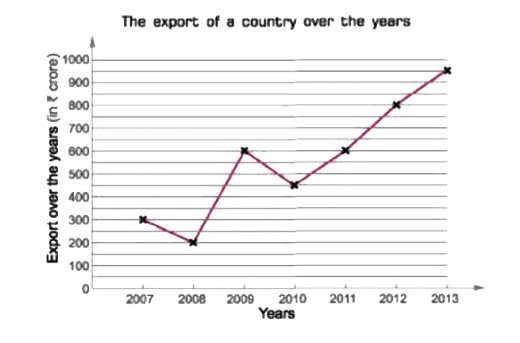
What is the total exports ( in ? Crore) for the given years ?
View Solution
Knowledge Check
Study the following bar graph carefully and answer the questions.
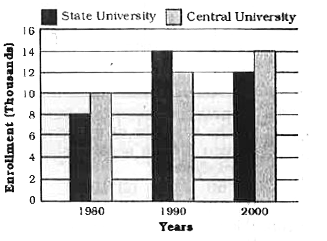
Total enrolments in both State University and Central University during the yar 1980, 1990 and 2000 isA80000B66000C70000D76000Study the following bar graph and answer the question that follows.
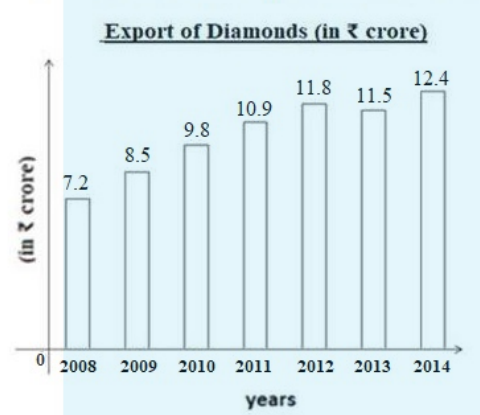
In which year was the maximin percentage increase in diamonds exports compared to the previous year?A2014B2009C2010D2012Study the following bar graph carefully and answer the questions.
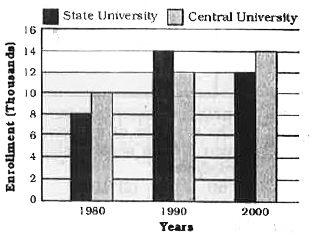
The ratio of the total enrolments in the year 1980 and 2000 at the State University and Central University isA4:5B2:3C6:5D9:13
Study the following bar-graph carefully and answer the question:
The average export of pearls for the given period (in crores Rs) is
View SolutionStudy the following bar graph carefully and answer the questions.
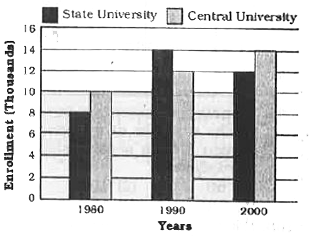
In 1990, how many more students were enrolled at State University that at Central University?
View SolutionStudy the following graph carefully and answer the questions that follow
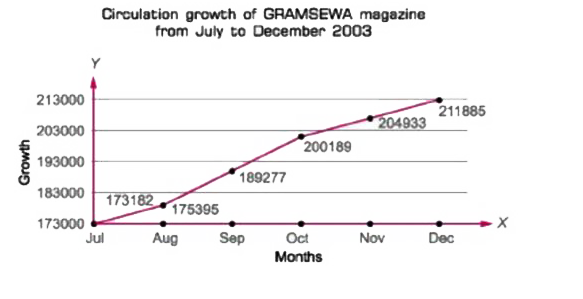
The growth rate is very marginal during the month of
View SolutionStudy the following graph carefully and answer the questions that
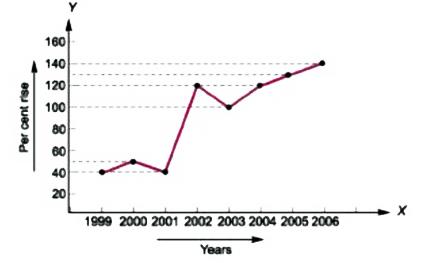
What was the average of percent rise over the given years ?
View SolutionStudy the following graph carefully and answer the questions that
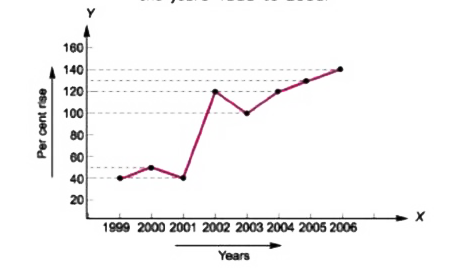
For how many years , the percent rise was more than 100 % ?
View Solution
