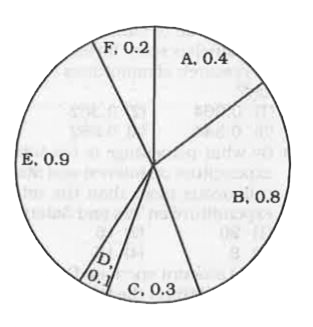
The pie-chart shows the annual car production (in millions) of six countries (A, B, C, D ,E, F). Study the diagram and answer the following questions.
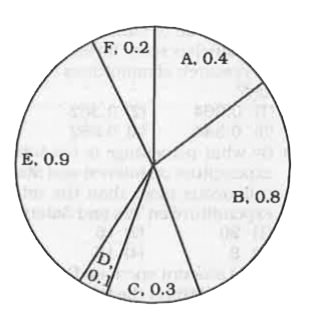
If on an average the cost price of a car is 30000 USD and environmental tax levied an each car is 2.5% of its cost price, how much environmental tax was collected (in billion USD) from production of cars in these 6 countries ?
1.03
2.03
3.03
4.03
The correct Answer is:2
Step by step video solution for The pie-chart shows the annual car production (in millions) of six countries (A, B, C, D ,E, F). Study the diagram and answer the following questions. If on an average the cost price of a car is 30000 USD and environmental tax levied an each car is 2.5% of its cost price, how much environmental tax was collected (in billion USD) from production of cars in these 6 countries ? by Maths experts to help you in doubts & scoring excellent marks in Class 14 exams.
Updated on:21/07/2023Similar Questions
The pie chart shows the annual car production of six countries (A,B,C,D,E,F) study the diagram and answer the following question
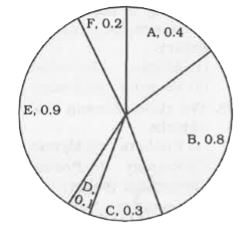
Which country produced the second least number of cars
View SolutionThe pie chart shows the annual car production of six countries (A,B,C,D,E,F) study the diagram and answer the following question
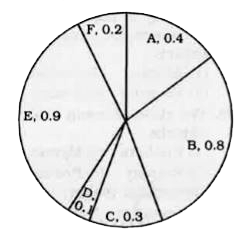
Country E produced how many more cars (in %) than that of country B
View Solution
Knowledge Check
The pie-chart shows the annual car production (in millions) of six countries (A, B, C, D ,E, F). Study the diagram and answer the following questions.
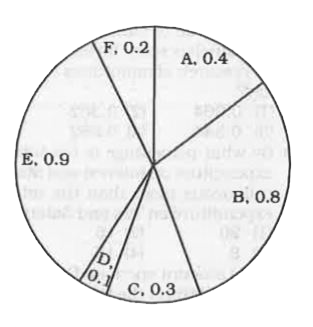
Which country produced the second least number of cars ?ADBFCCDAThe pie chart shows the annual car production of six countries (A,B,C,D,E,F) study the diagram and answer the following question

Country E produced how many more cars (in %) than that of country BA10B12.5C11.11D8The pie-chart shows the annual car production (in millions) of six countries (A, B, C, D ,E, F). Study the diagram and answer the following questions.
If 35% of the cars produced by these six countries are diesel and the rest are petrol, then how many petrol cars were produced (in millions) ?A1.755B0.945C2.7D1.8
The pie chart shows the annual car production of six countries (A,B,C,D,E,F) study the diagram and answer the following question
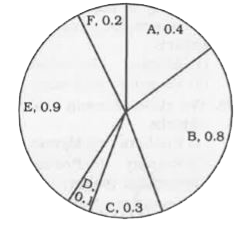
If 35% of the cars produced by these six countries are die then how many petrol cars were produced
View SolutionThe pie chart shows the value of the total annual production of dry fruits of a country. Study the diagram and answer the following questions.The value of annual production of which dry fruit item is the least ?
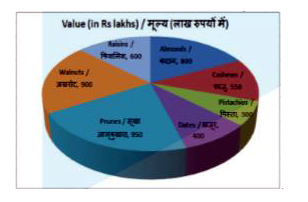
View SolutionThe pie chart shows the value of the total annual production of dry fruits of a country. Study the diagram and answer the following questions.
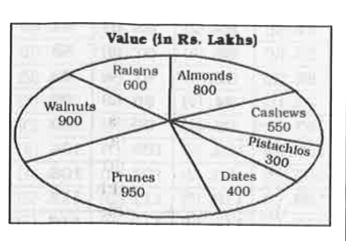
If the average of almonds produced is Rs. 800 per kg., how many kgs. Of almonds were produced?
View SolutionThe pie chart shows the value of the total annual agricultural production of a country. Study the diagram and answer the following questions.
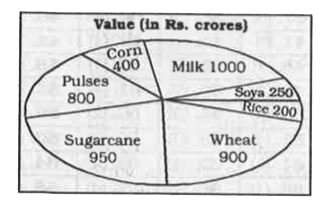
The value of annual production of which agricultural item is the most?
View SolutionThe pie chart shows the value of the total annual production of dry fruits of a country. Study the diagram and answer the following questions.
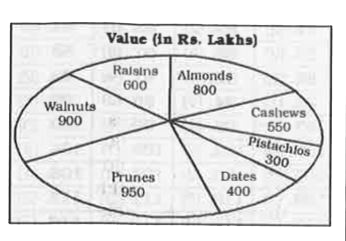
The value of annual production of which dry fruit item is the most?
View Solution
