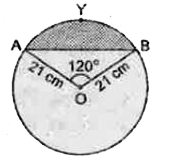
आकृति में दर्शाए गए वृत्तखंड का क्षेत्रफल ज्ञात कीजिए, यदि वृत्त की त्रिज्या 21 cm है और ∠AOB = 120∘ है।

The correct Answer is:214(88−21√3)cm2
Step by step video & image solution for आकृति में दर्शाए गए वृत्तखंड का क्षेत्रफल ज्ञात कीजिए, यदि वृत्त की त्रिज्या 21 cm है और angleAOB = 120^(@) है। by Maths experts to help you in doubts & scoring excellent marks in Class 10 exams.
Topper's Solved these Questions
- BOOK - ALOK BHARTI PUBLICATIONCHAPTER - व्रतों से सम्बंधित क्षेत्रफल EXERCISE - लघु उत्तरीय प्रश्न एवं उत्तर32videos
व्रतों से सम्बंधित क्षेत्रफल
- BOOK - ALOK BHARTI PUBLICATIONCHAPTER - वृत्तों से सम्बन्धित क्षेत्रफलEXERCISE - प्रश्नावली 10.25videos
वृत्तों से सम्बन्धित क्षेत्रफल
- BOOK - ALOK BHARTI PUBLICATIONCHAPTER - समरूप त्रिभुज EXERCISE - प्रश्नावली (EXERCISE) 6.431videos
समरूप त्रिभुज
Similar Questions
त्रिज्या 4 cm वाले एकवृत्त के त्रिज्यखंड का क्षेत्रफल ज्ञात कीजिए, जिसका कोण 30∘ है। साथ ही, संगत दीर्घ त्रिज्यखंड का क्षेत्रफल भी ज्ञात कीजिए।
01:37View Solutionकिसी विषमबाहु त्रिभुज की भुजाएँ क्रमशः 6 cm, 5 cm एवं 3 cm है। इस त्रिभुज के अन्तःवृत्त का क्षेत्रफल ज्ञात करें।
06:07View Solutionनीचे कुछ त्रिभुजों की भुजाएँ दी गई है। बताएँ इनमें से कौन-कौन सी समकोण त्रिभुज की भुजाएँ हैं।
(i)9cm, 12cm, 15cm (ii) 10 cm, 16cm, 22 cm
(ii)4cm,7.5cm,8.5cm (iv)7cm, 24 cm, 25 cm02:11View SolutionHow many lines of symmetry does the above figure have ?
01:31View SolutionWhich of the following are correct chain isomers of butane ? (i)
02:45View SolutionDetermine the point of symmetry of a regular hexagon.
02:17View SolutionDtermine the images of the following figure about the given line :
05:41View SolutionMatch the following Column A to Column B
 02:21View Solution
Match the following Column A to Column B
 02:03View Solution
Match the following Column A to Column B
 02:10View Solution
Find the area of the figure given below.
 02:17View Solution
The area of the shaded part in the figure given below is ______.
 02:10View Solution
The inequation represented by the graph given below is :
04:23View SolutionThe inequation that best describes the graph given below is _________
01:13View SolutionThe inequation that best describes the following graph is _________
03:12View SolutionWhich inequations represent the shaded region in the given figure
05:46View Solution

