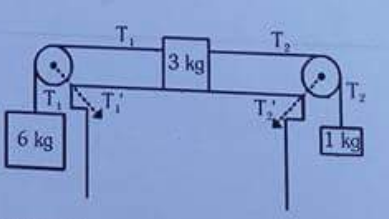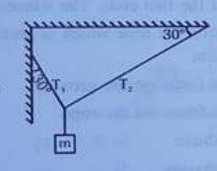
Calculate a, .
The correct Answer is:
Step by step video & image solution for Calculate a, T_(1), T_(2), T_(1)' & T_(2)'. by Physics experts to help you in doubts & scoring excellent marks in Class 12 exams.
Updated on:21/07/2023Topper's Solved these Questions
- RACEBOOK - ALLENCHAPTER - RACEEXERCISE - Basic Maths (FRICTION)
11 Videos
- RACEBOOK - ALLENCHAPTER - RACEEXERCISE - Basic Maths (WORK POWER & ENERGY)
20 Videos
- RACEBOOK - ALLENCHAPTER - RACEEXERCISE - Basic Maths (KINEMATICS)
59 Videos
- NEWTONS LAWS OF MOTIONBOOK - ALLENCHAPTER - NEWTONS LAWS OF MOTIONEXERCISE - EXERCISE-III
28 Videos
- SIMPLE HARMONIC MOTIONBOOK - ALLENCHAPTER - SIMPLE HARMONIC MOTIONEXERCISE - Example
1 Videos
Similar Questions
Knowledge Check
If two gases of moleuclar weight M1andM2 at temperature T1andT2,T1M2=T2M1, then which property has the same magnitude of both the gases?
ATemperatureBPressureCKE per moleDRoot mean square velocityConsider three blocks of masses m1,m2,m3 interconnected by strings which are pulled by a common force F on a frictionless horizontal table as in the figure. The tension T1andT2 are also indicated

a) T2>T1 if m2>m1
b) T2=T1 if m2=m1
c) T2>T1 always
d) acceleration of the system=Fm1+m2+m3Aa, bBb, dCa, dDc, dA black body radiates heat at temperatures T1 and T2(T2>T1 the frequency corresponding to maxium energy is
Amore atT1Bmore at T2Cequal for T1 and T2Dindependent of T1 and T2
The average speed at T1K and the most probable speed at T2K of CO2 gas is 9×10⁴cms−1. Calculate the value of T1 and T2.
View SolutionShow that the relation R defined in the set A of all triangles as R={(T1,T2):T1 is similar to T2}, is equivalence relation.
View SolutionThe average velocity of CO2 at the temperature T1K and maximum (most) proable velocity of CO2 at the temperature T2K is 9×10⁴cms−1. Calculate the values of T1 and T2.
View SolutionA black body radiates heat at temperatures T1 and T2(T2>T1 the frequency corresponding to maxium energy is
View SolutionShown below are the black body radiation curves at temperature T1 and T2(T2>T1). Which of the following plots is correct?
View Solution

