The number of candidates who qualified the test from zone R in the year 2010 was approximately what percentage of the number of candidates who appeared from zone Q in the year 2008? (a) 152 (b) 147 (c) 142 (d) 132 (e) 137
To solve the problem step by step, we need to find the percentage of candidates who qualified from zone R in 2010 compared to those who appeared from zone Q in 2008.
Step 1: Identify the numbers
From the video transcript, we have:
- Number of candidates who qualified from zone R in 2010 = 74 (as inferred from 7.4 multiplied by 10)
- Number of candidates who appeared from zone Q in 2008 = 54 (as inferred from 5.4 multiplied by 10)
Step 2: Set up the percentage formula
To find the percentage of candidates who qualified from zone R in 2010 relative to those who appeared from zone Q in 2008, we use the formula:
Percentage=(Number of candidates who qualified from zone RNumber of candidates who appeared from zone Q)×100
Step 3: Substitute the values into the formula
Substituting the identified values into the formula, we get:
Percentage=(7454)×100
Step 4: Simplify the fraction
Now, we simplify the fraction:
7454=3727(dividing numerator and denominator by 2)
Step 5: Calculate the percentage
Now, we multiply by 100:
Percentage=(3727)×100
Calculating this gives:
Percentage=370027≈137.037
Step 6: Round to the nearest whole number
Since we are looking for an approximate percentage, we round 137.037 to 137.
Conclusion
Thus, the number of candidates who qualified the test from zone R in the year 2010 was approximately 137% of the number of candidates who appeared from zone Q in the year 2008. Therefore, the answer is option (e) 137.
---
From the video transcript, we have:
- Number of candidates who qualified from zone R in 2010 = 74 (as inferred from 7.4 multiplied by 10)
- Number of candidates who appeared from zone Q in 2008 = 54 (as inferred from 5.4 multiplied by 10)
To find the percentage of candidates who qualified from zone R in 2010 relative to those who appeared from zone Q in 2008, we use the formula:
Percentage=(Number of candidates who qualified from zone RNumber of candidates who appeared from zone Q)×100
Substituting the identified values into the formula, we get:
Percentage=(7454)×100
Now, we simplify the fraction:
7454=3727(dividing numerator and denominator by 2)
Now, we multiply by 100:
Percentage=(3727)×100
Calculating this gives:
Percentage=370027≈137.037
Since we are looking for an approximate percentage, we round 137.037 to 137.
Thus, the number of candidates who qualified the test from zone R in the year 2010 was approximately 137% of the number of candidates who appeared from zone Q in the year 2008. Therefore, the answer is option (e) 137.
Topper's Solved these Questions
Similar Questions
Knowledge Check
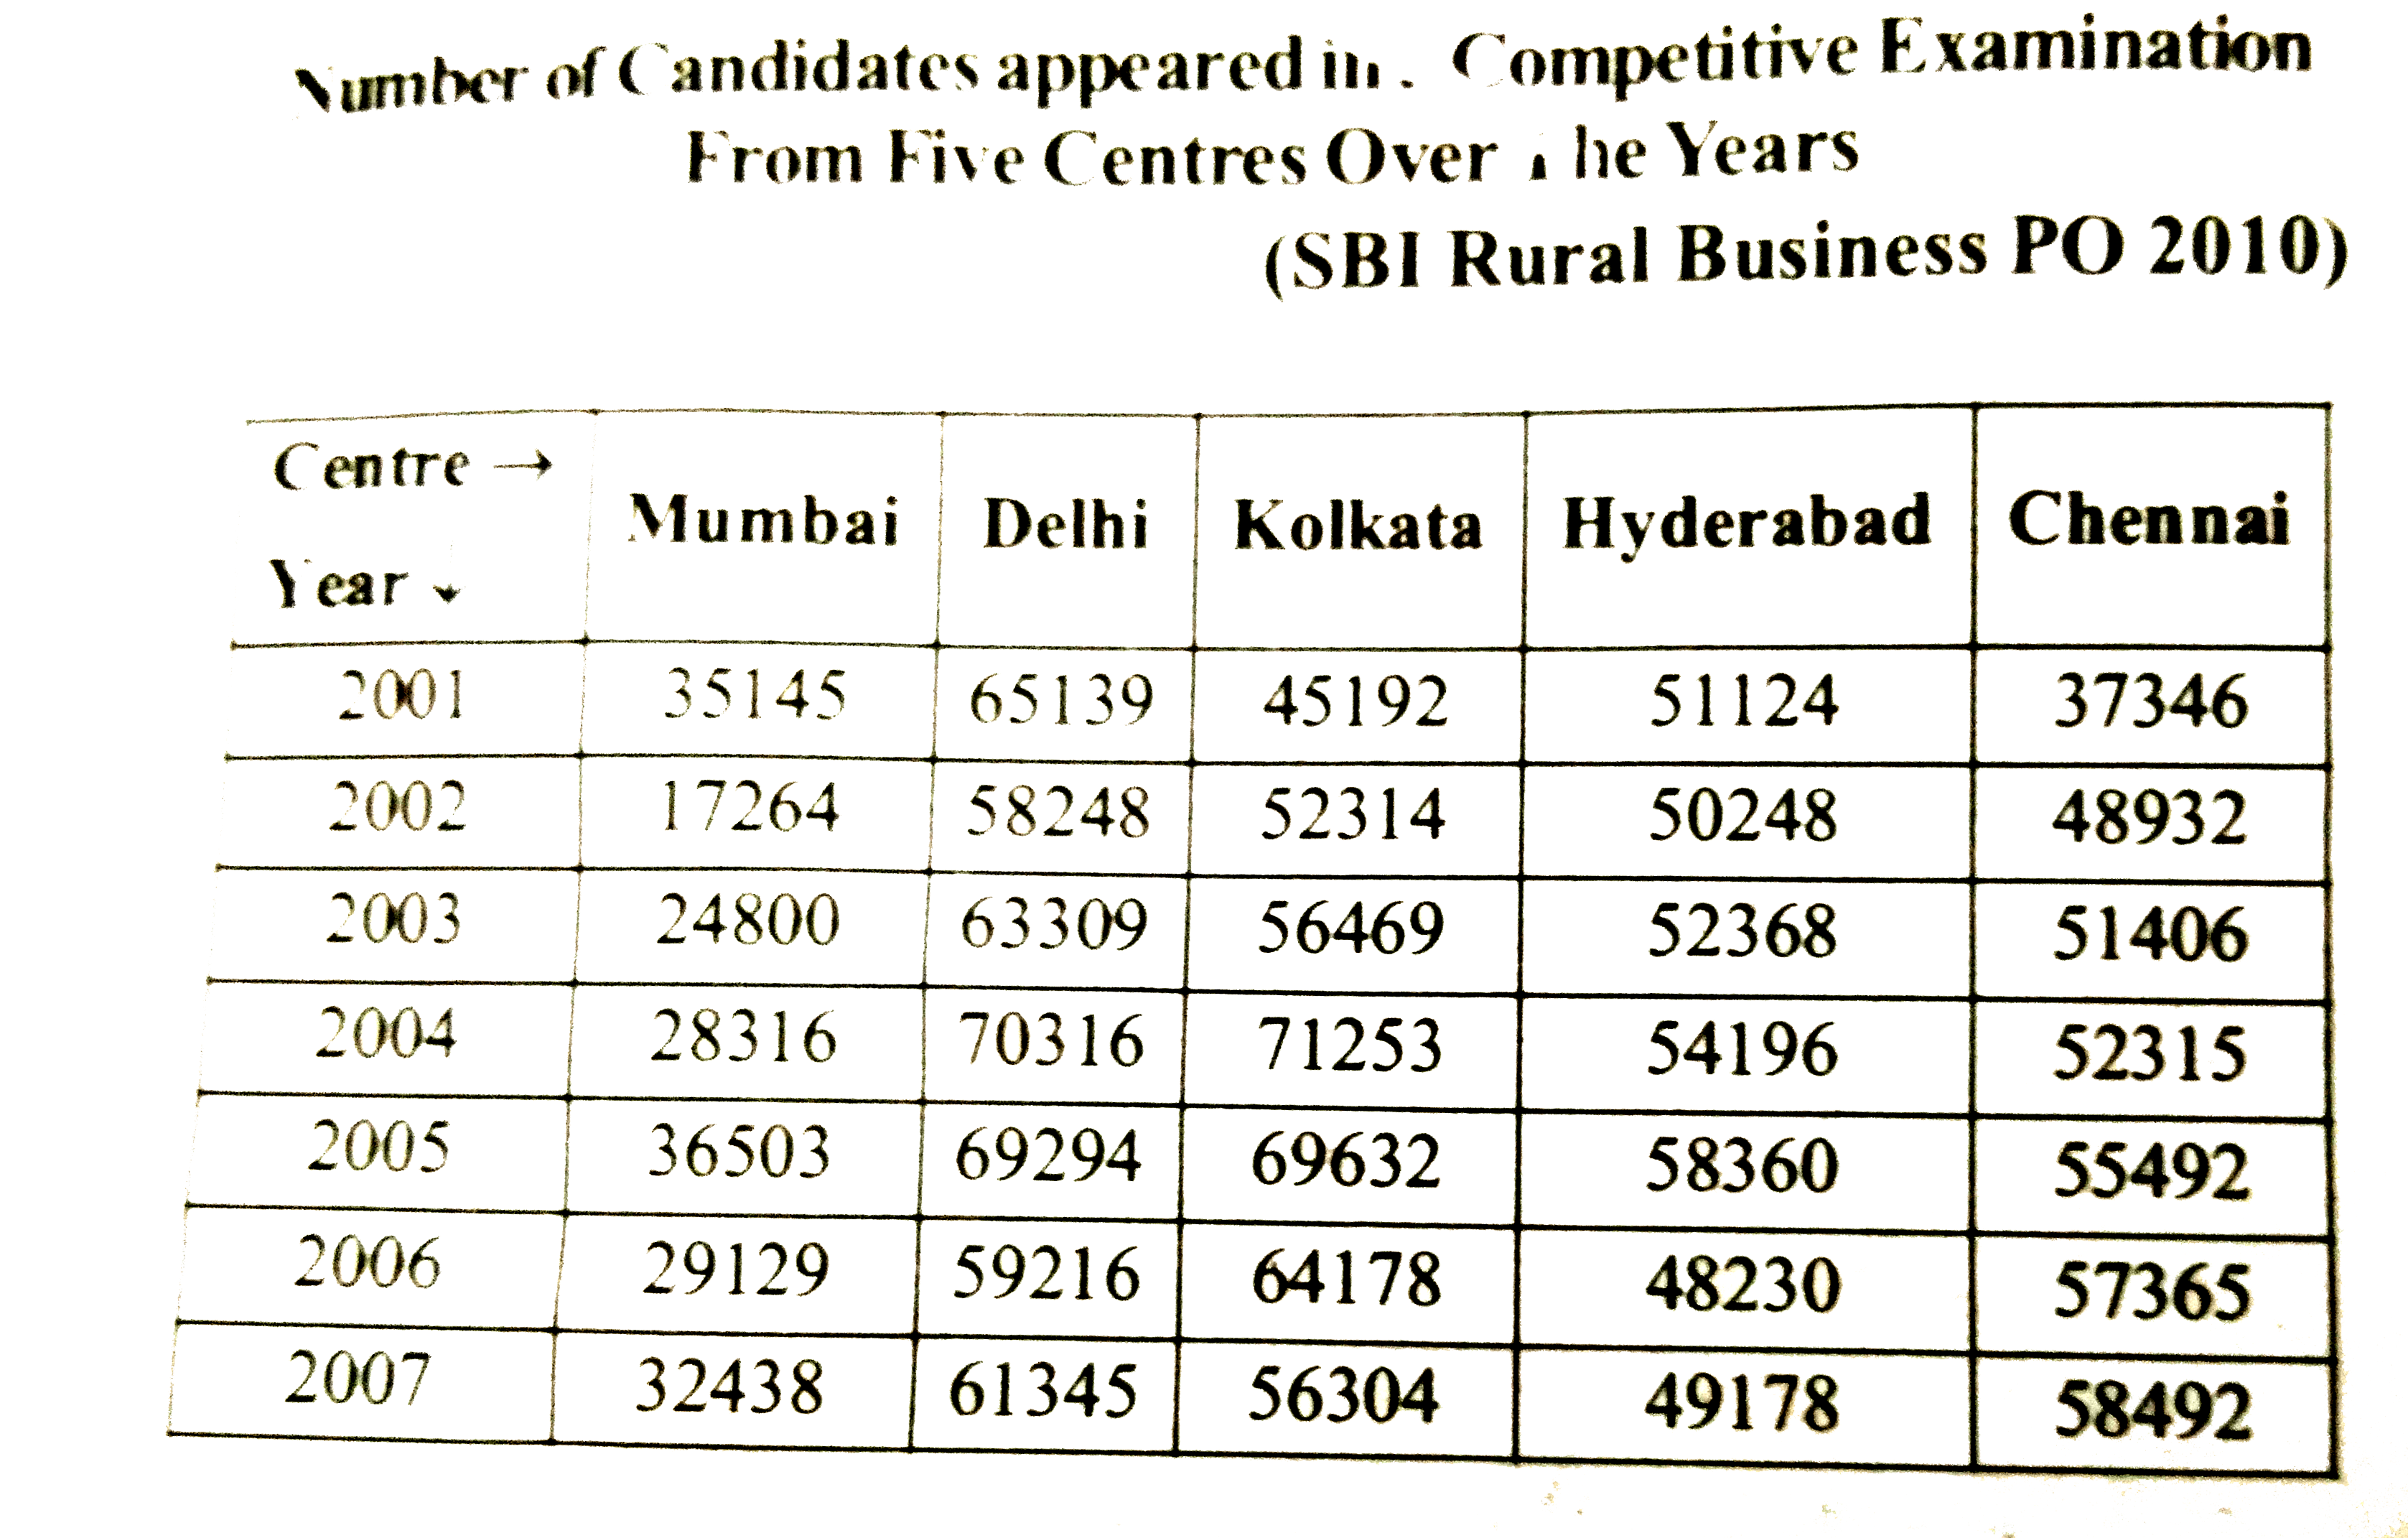
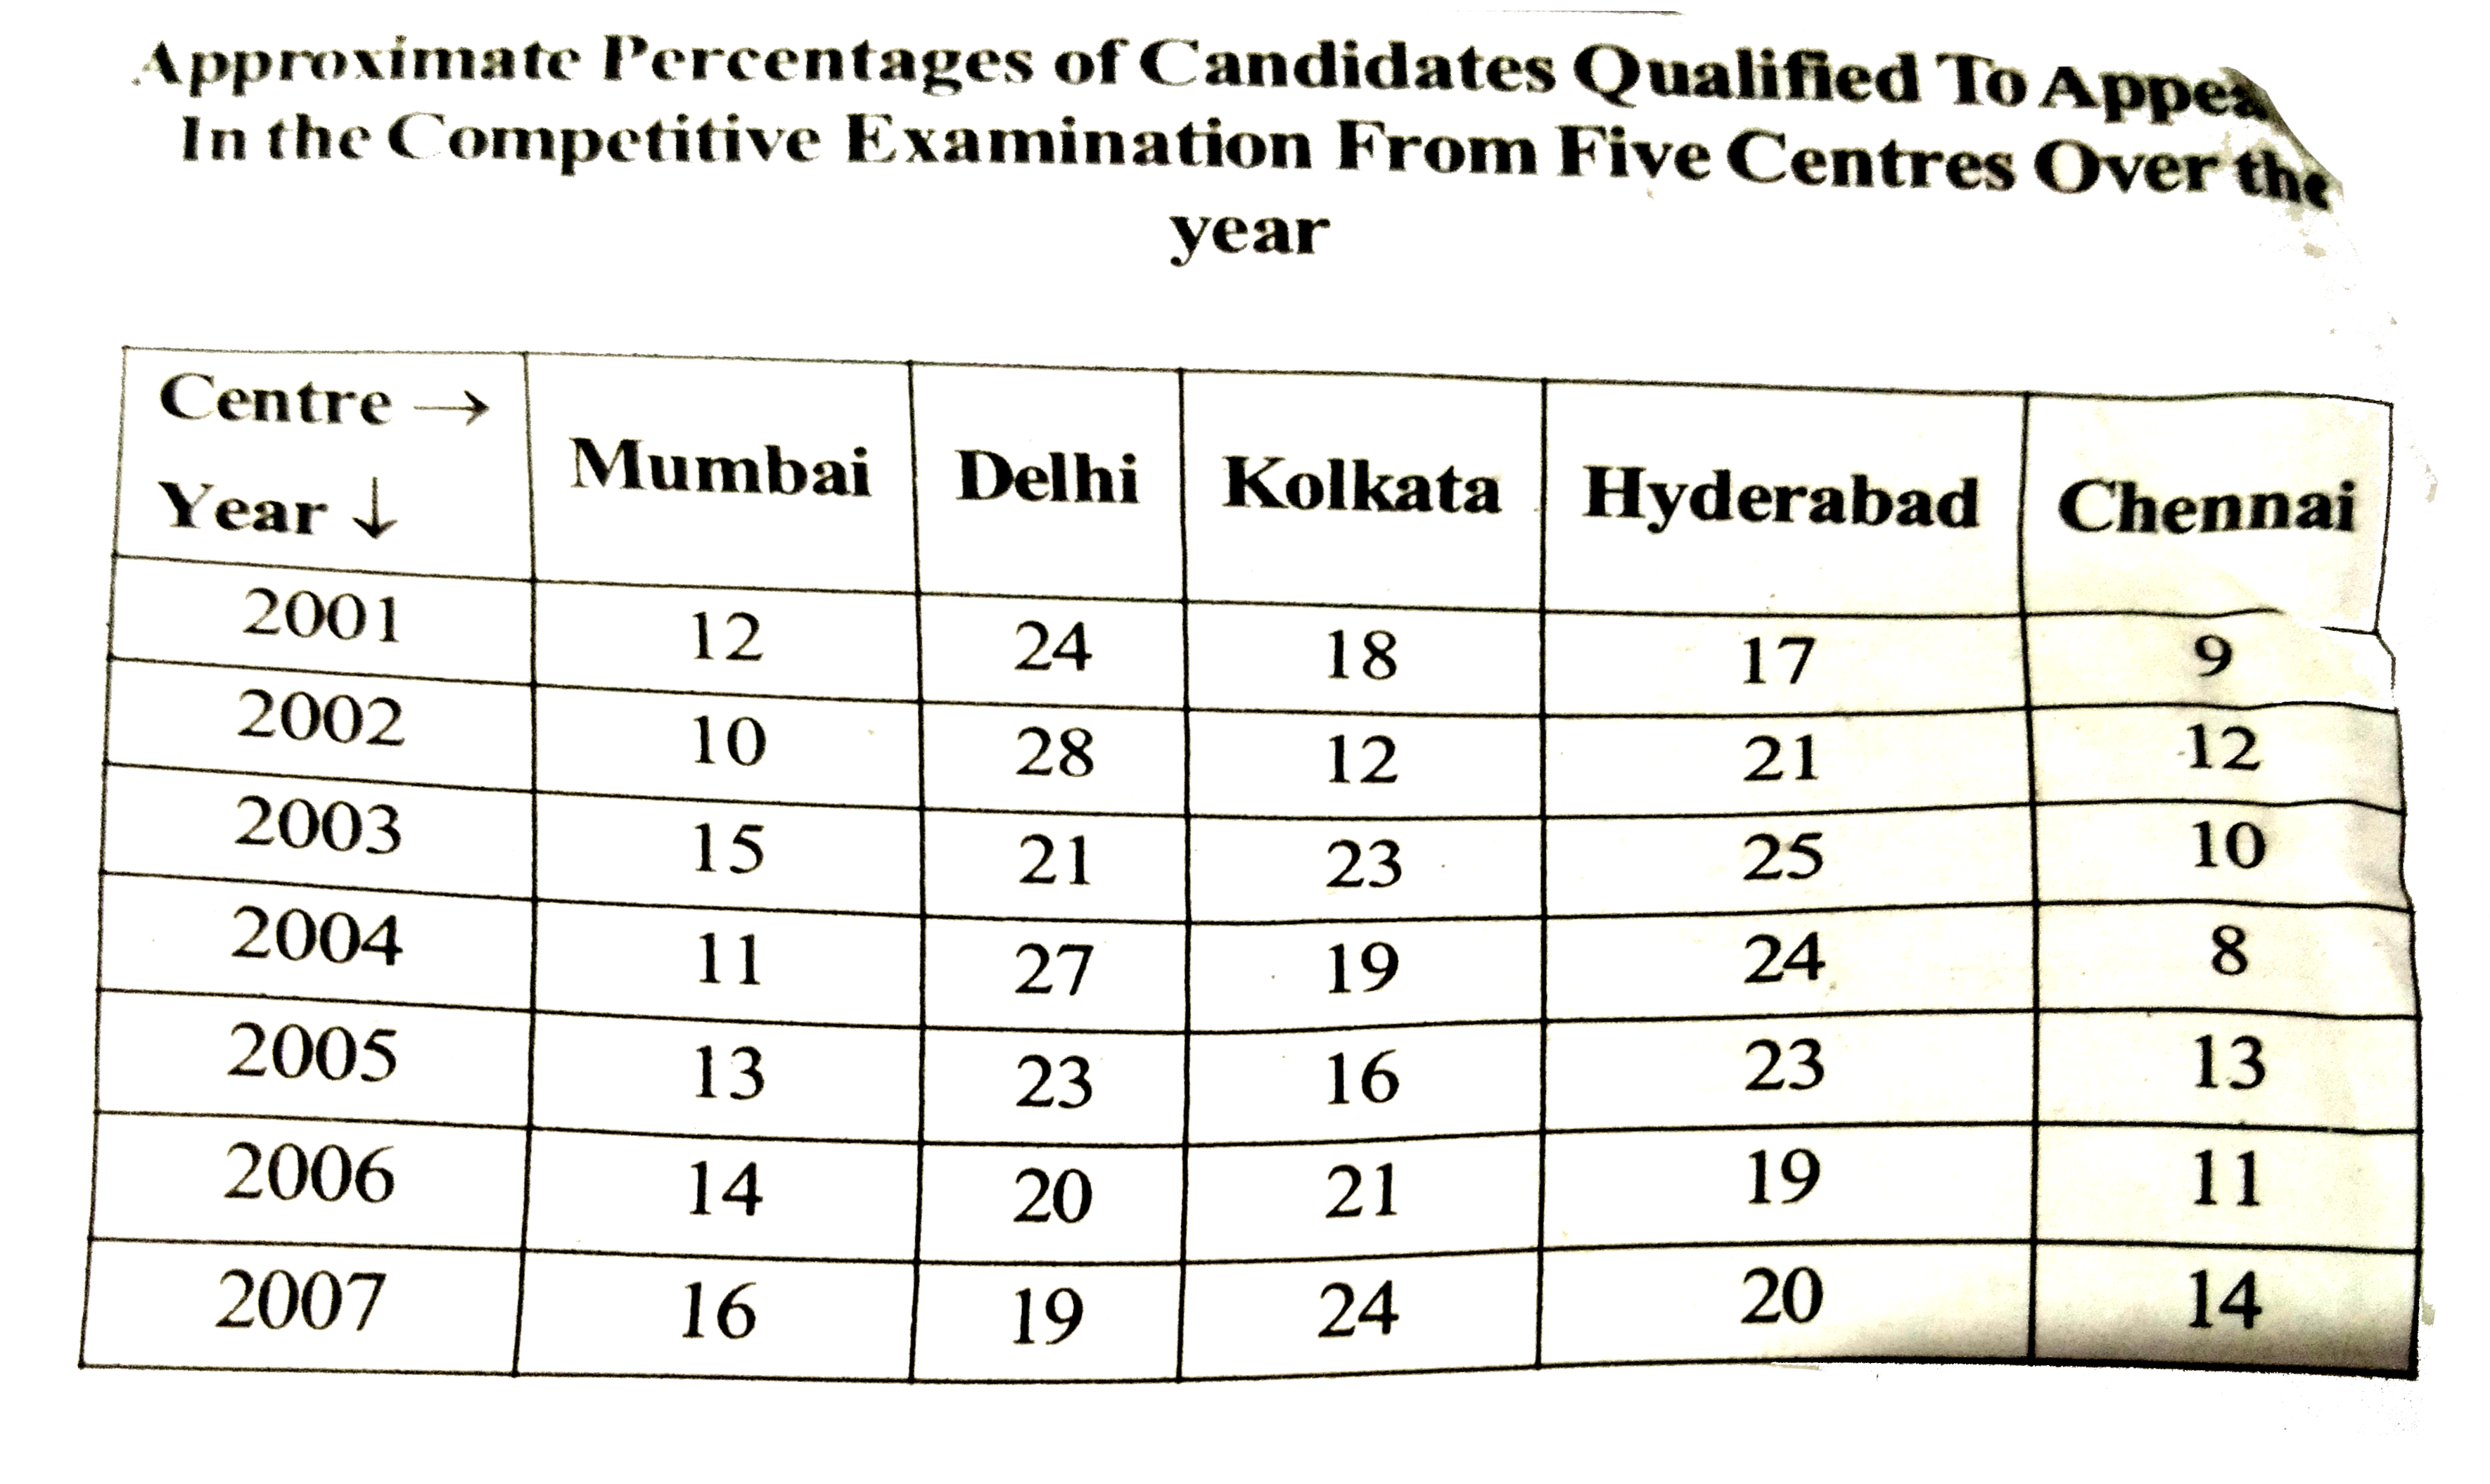
Approximately wha was the total number of candidates qualified from Delhi in 2002 and 2006 together?A27250B25230C30150D26250The following table represents the number of candidates that appeared and qualified in a competitive examination from different states over five years. Study the table and answer the questions that follow.
निम्नलिखित तालिका उन उम्मीदवारों की संख्या को दर्शाती है जो पाँच वर्षों के दौरान विभिन्न राज्यों से किसी प्रतियोगी परीक्षा में शामिल हुए तथा सफल हुए | इस तालिका का अध्ययन कीजिए तथा फिर पूछे गए प्रश्नों के उत्तर दीजिए | What was the total number of candidates appearing from all the states in the year 1997?
वर्ष 1997 में सभी राज्यों से शामिल होने वाले उम्मीदवारों की कुल संख्या कितनी है ?A27200B72200C22700D27000The following table represents the number of candidates that appeared and qualified in a competitive examination from different states over five years. Study the table and answer the questions that follow.
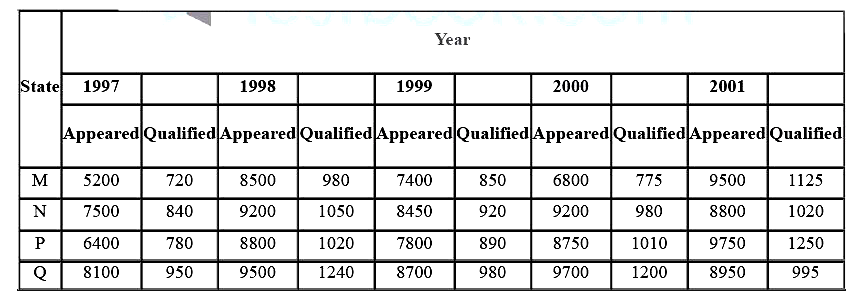
The total number of candidates that qualified from all the states together in 1998 is approximately what percentage of the total number of candidates that qualified from all the states together in 2001? (Correct to Two decimal points)Aa. 90.72%Bb. 97.72%Cc. 96.70%Dd. 94.7%
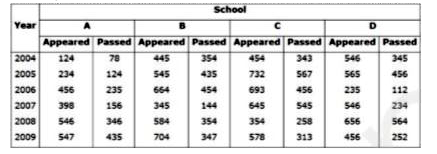
Number of candidates who passed in the exam from school B in the year 2005 was approximately what percent of number of students appeared in school - A in the year 2008 ?
View SolutionThe semester fee charged for M.Phil. course in the year 2008 was approximately what percentage of the semester fee charged for M.Sc. course in the year 2009? (a) 67 (b) 84 (c) 80 (d) 76 (e) 72
View Solution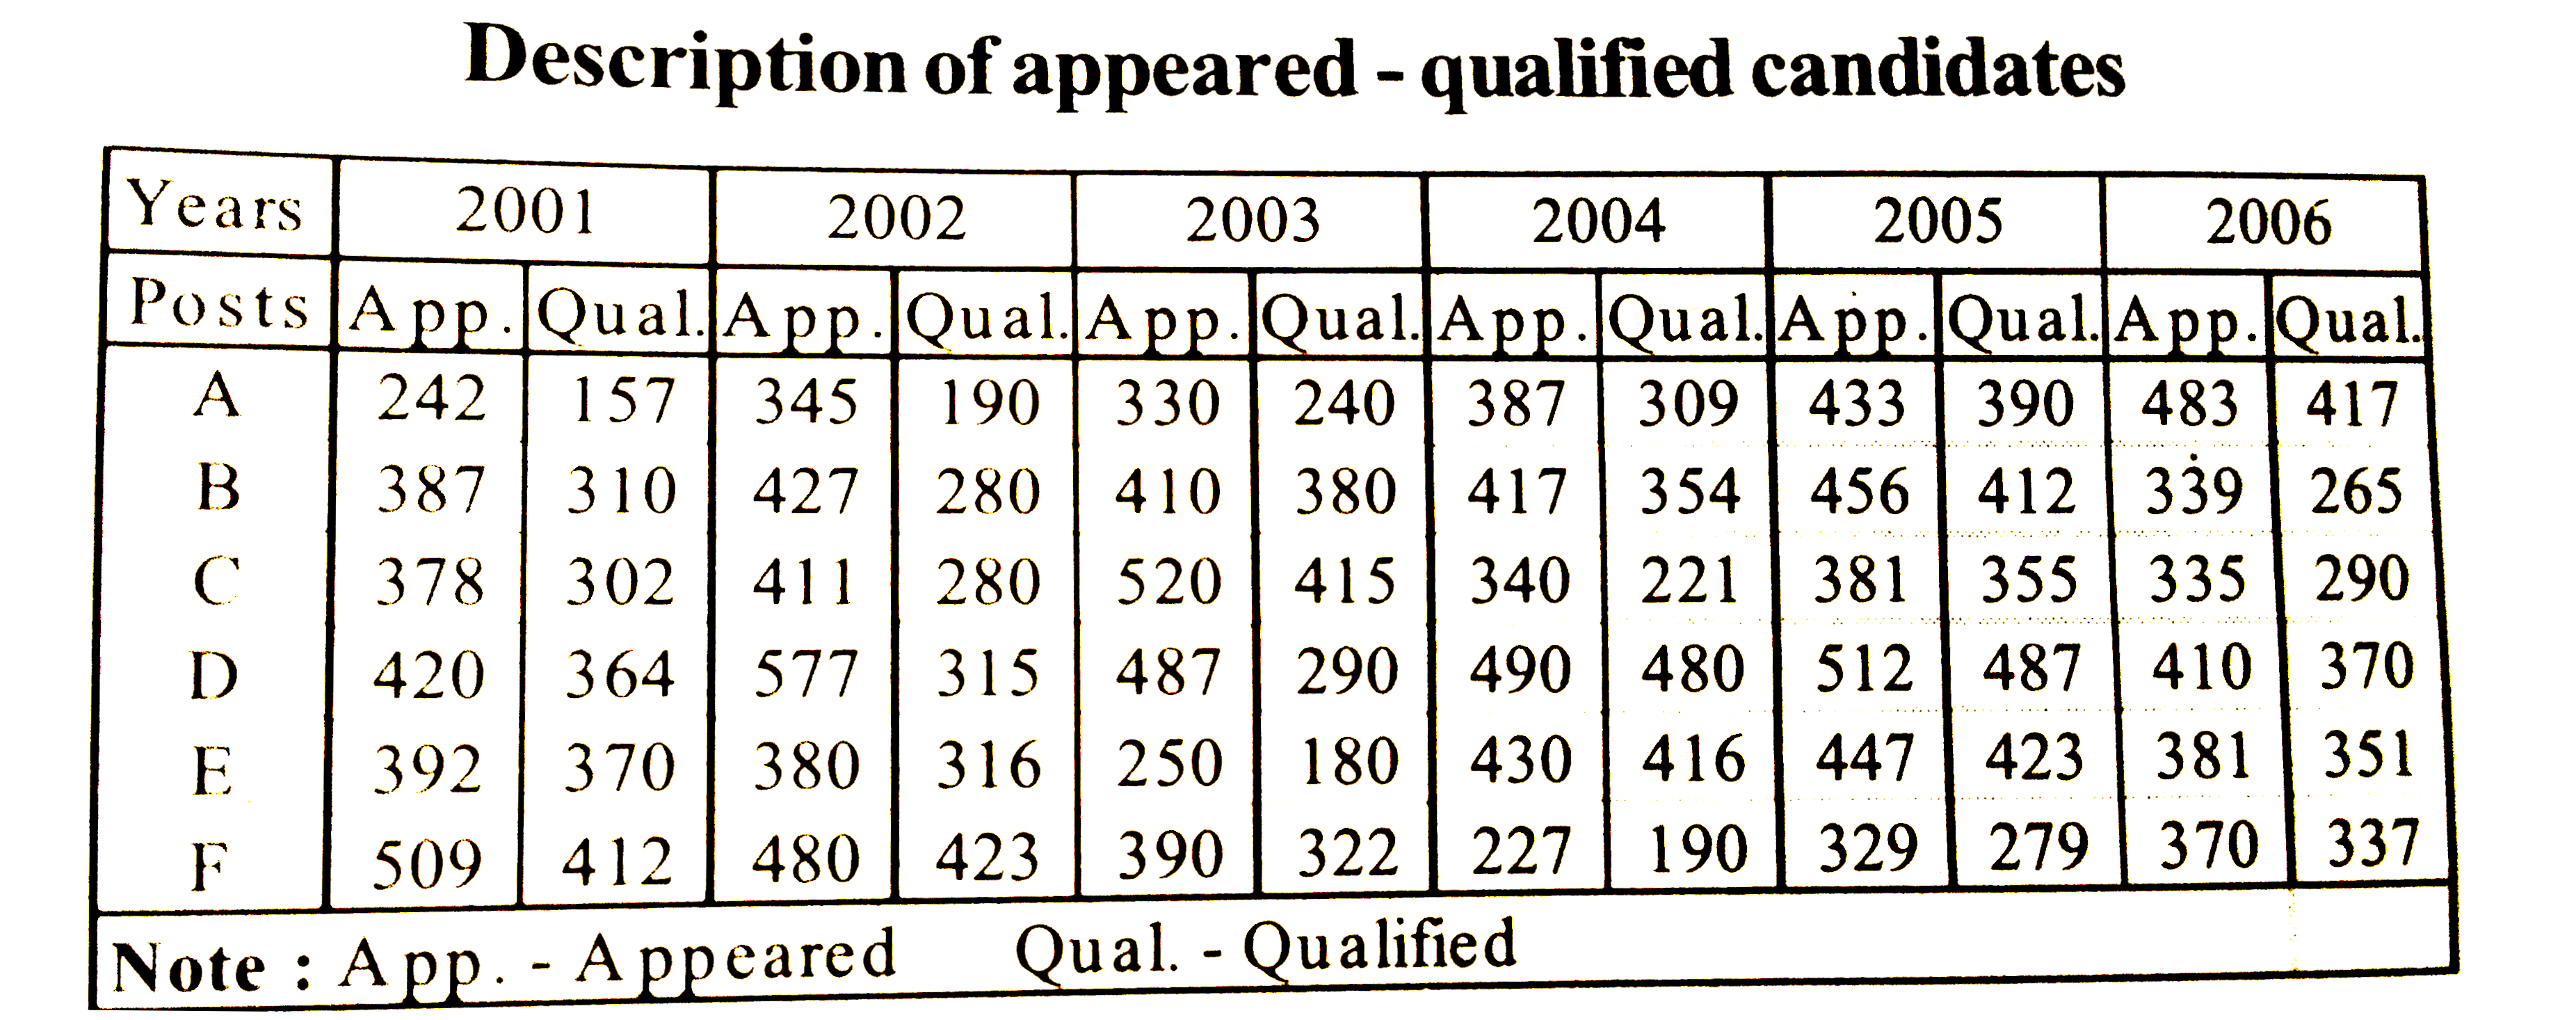
What is the approximate average number of candidates who qualified for all the posts in the year 2002?
View SolutionWhat was the average number of candidates appeared from zone T over all the years together? (a) 810 (b) 815 (c) 825 (d) 805 (e) 820
View SolutionThe number of students appearing for the Aptitude Test from Town D is approximately what percentage of the number of students appearing for the Aptitude Test from Town C ? (a) 243 (b) 413 (c) 134 (d) 341 (e) 143
View Solution

