The figure shows graphs of the electric field magnitude E versus time t for four uniform electric fields, all contained within identical circular regions. Which of them is according to the magnitudes of the magnetic field?

A
B
C
D
The correct Answer is:C
∮→B.d→l√b2−4ac=μ0∈0dϕPdt
orB×2πr=μ0∈04(dEdt) ∴B∝(dEdt)
Topper's Solved these Questions
- ELECTROMAGNETIC WAVESBOOK - DISHA PUBLICATIONCHAPTER - ELECTROMAGNETIC WAVESEXERCISE - Exercise - 1 : Concept Builder (Topicwise)(Topic 2 : Electromagnetic Spectrum)
22 Videos
- ELECTROMAGNETIC WAVESBOOK - DISHA PUBLICATIONCHAPTER - ELECTROMAGNETIC WAVESEXERCISE - Exercise - 2 : Concept Applicator
30 Videos
- ELECTROMAGNETIC WAVESBOOK - DISHA PUBLICATIONCHAPTER - ELECTROMAGNETIC WAVESEXERCISE - Exercise - 2 : Concept Applicator
30 Videos
- ELECTROMAGNETIC INDUCTION BOOK - DISHA PUBLICATIONCHAPTER - ELECTROMAGNETIC INDUCTION EXERCISE - EXERCISE - 2 : Concept Applicator
29 Videos
- ELECTROSTATIC POTENTIAL AND CAPACITANCEBOOK - DISHA PUBLICATIONCHAPTER - ELECTROSTATIC POTENTIAL AND CAPACITANCEEXERCISE - EXERCISE 2: CONCEPT APPLICATOR
24 Videos
Similar Questions
Knowledge Check
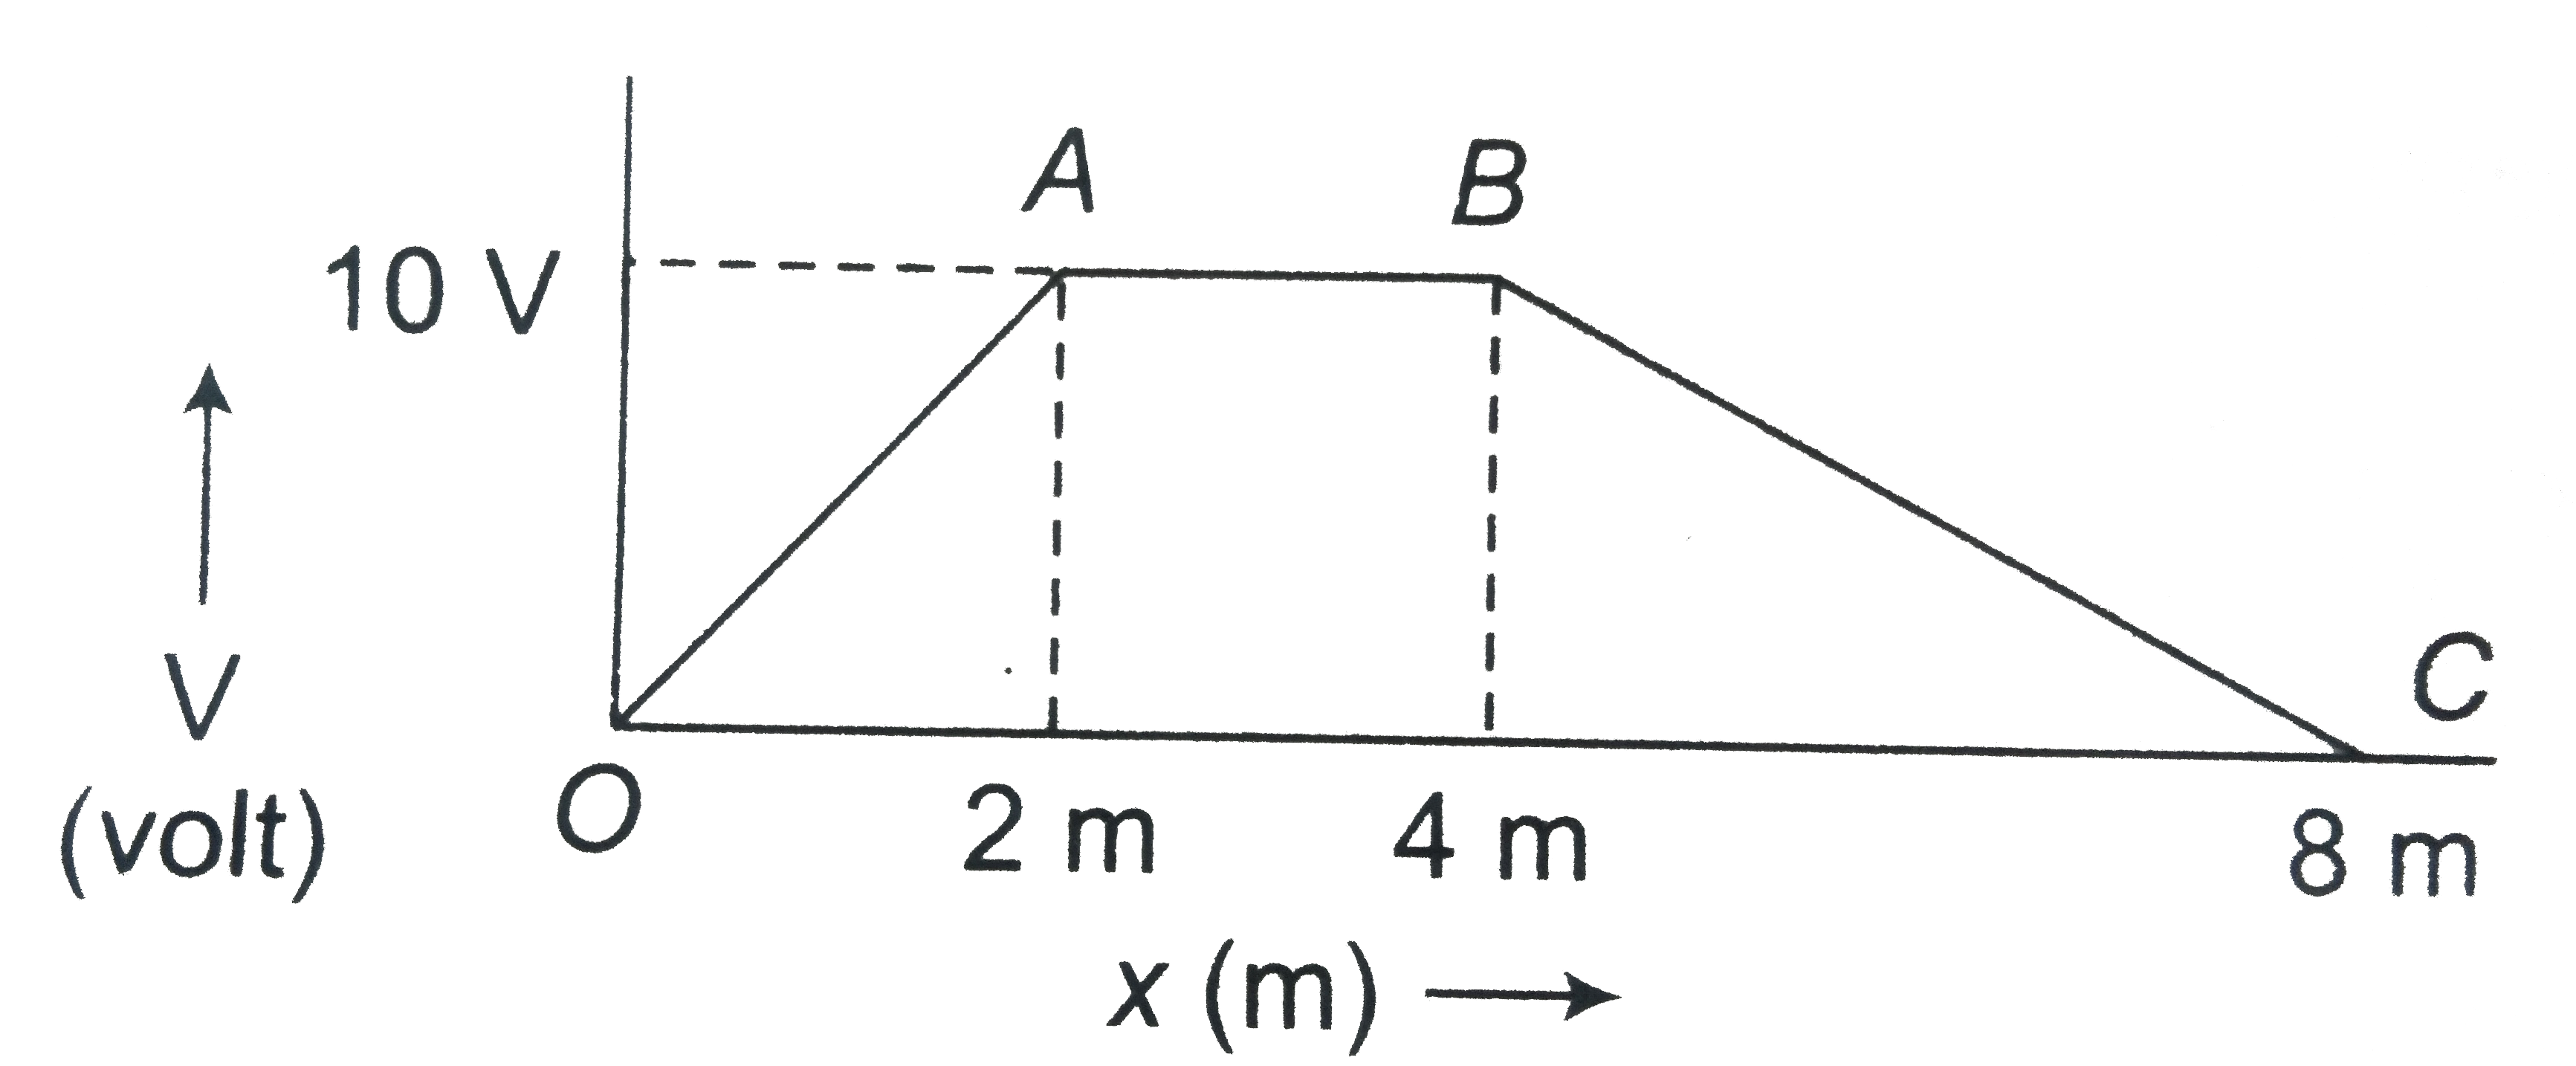
In the following graph , the magnitude of maximum electric field is
 A5V/mB2.5V/mC1.25V/mD10V/m
In a certain region of space the electric potential V is known to be constant. Is the electric field in this region (a) positive (b) zero ,or (c ) negative ?
AAlso constantBPositiveCNegativeDZeroWhich of the following is not true for a region with a uniform electric field?
AIt can have free charges.BIt may have uniformly distributed chargeCIt may contain dipolesDnone of the above
The adjoining figure shows the lines of constant potential in a region in which an electric field is present. The value of potentials are shown. At which of the points A, B and C is the magnitude of the electric field the greatest?
View SolutionFigure shows a graph between the magnitude of magnetic field passing normally through a closed loop and time t. Rank the five region's of the graph according to the emf in magnitude indụced in the loop, greatest first.
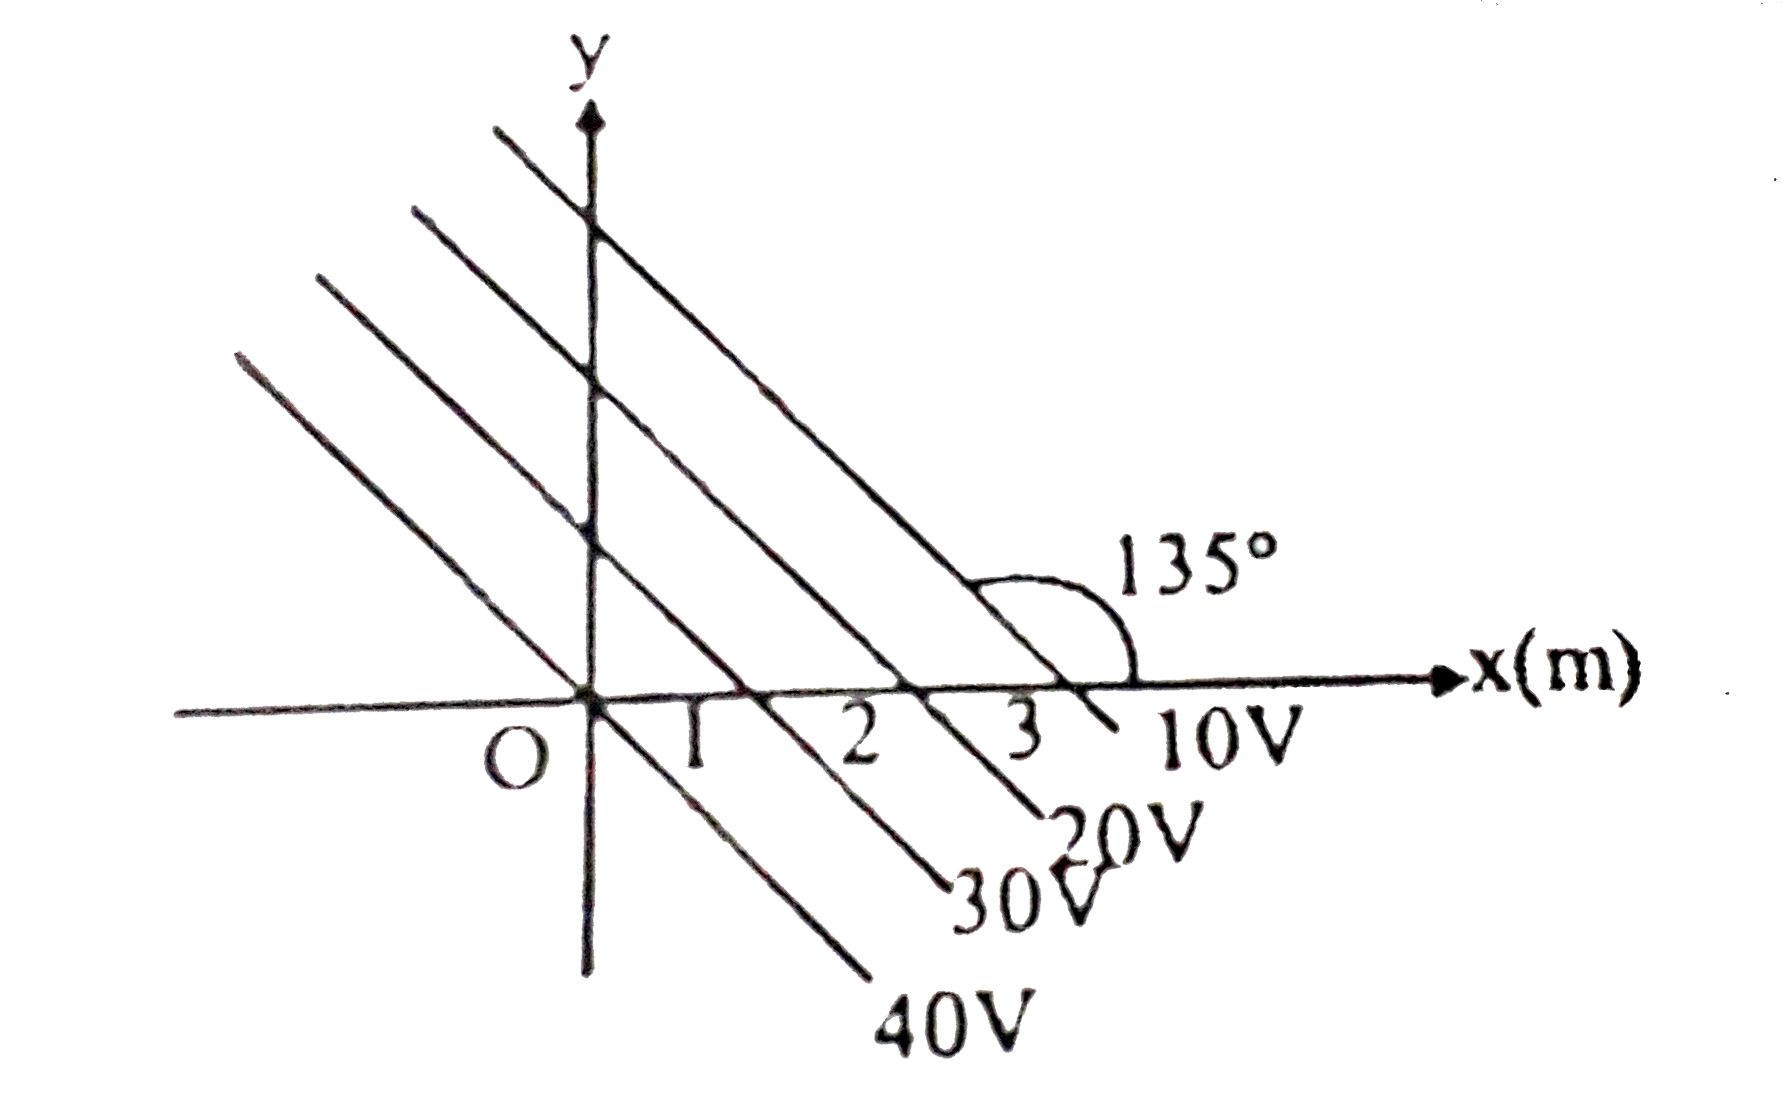
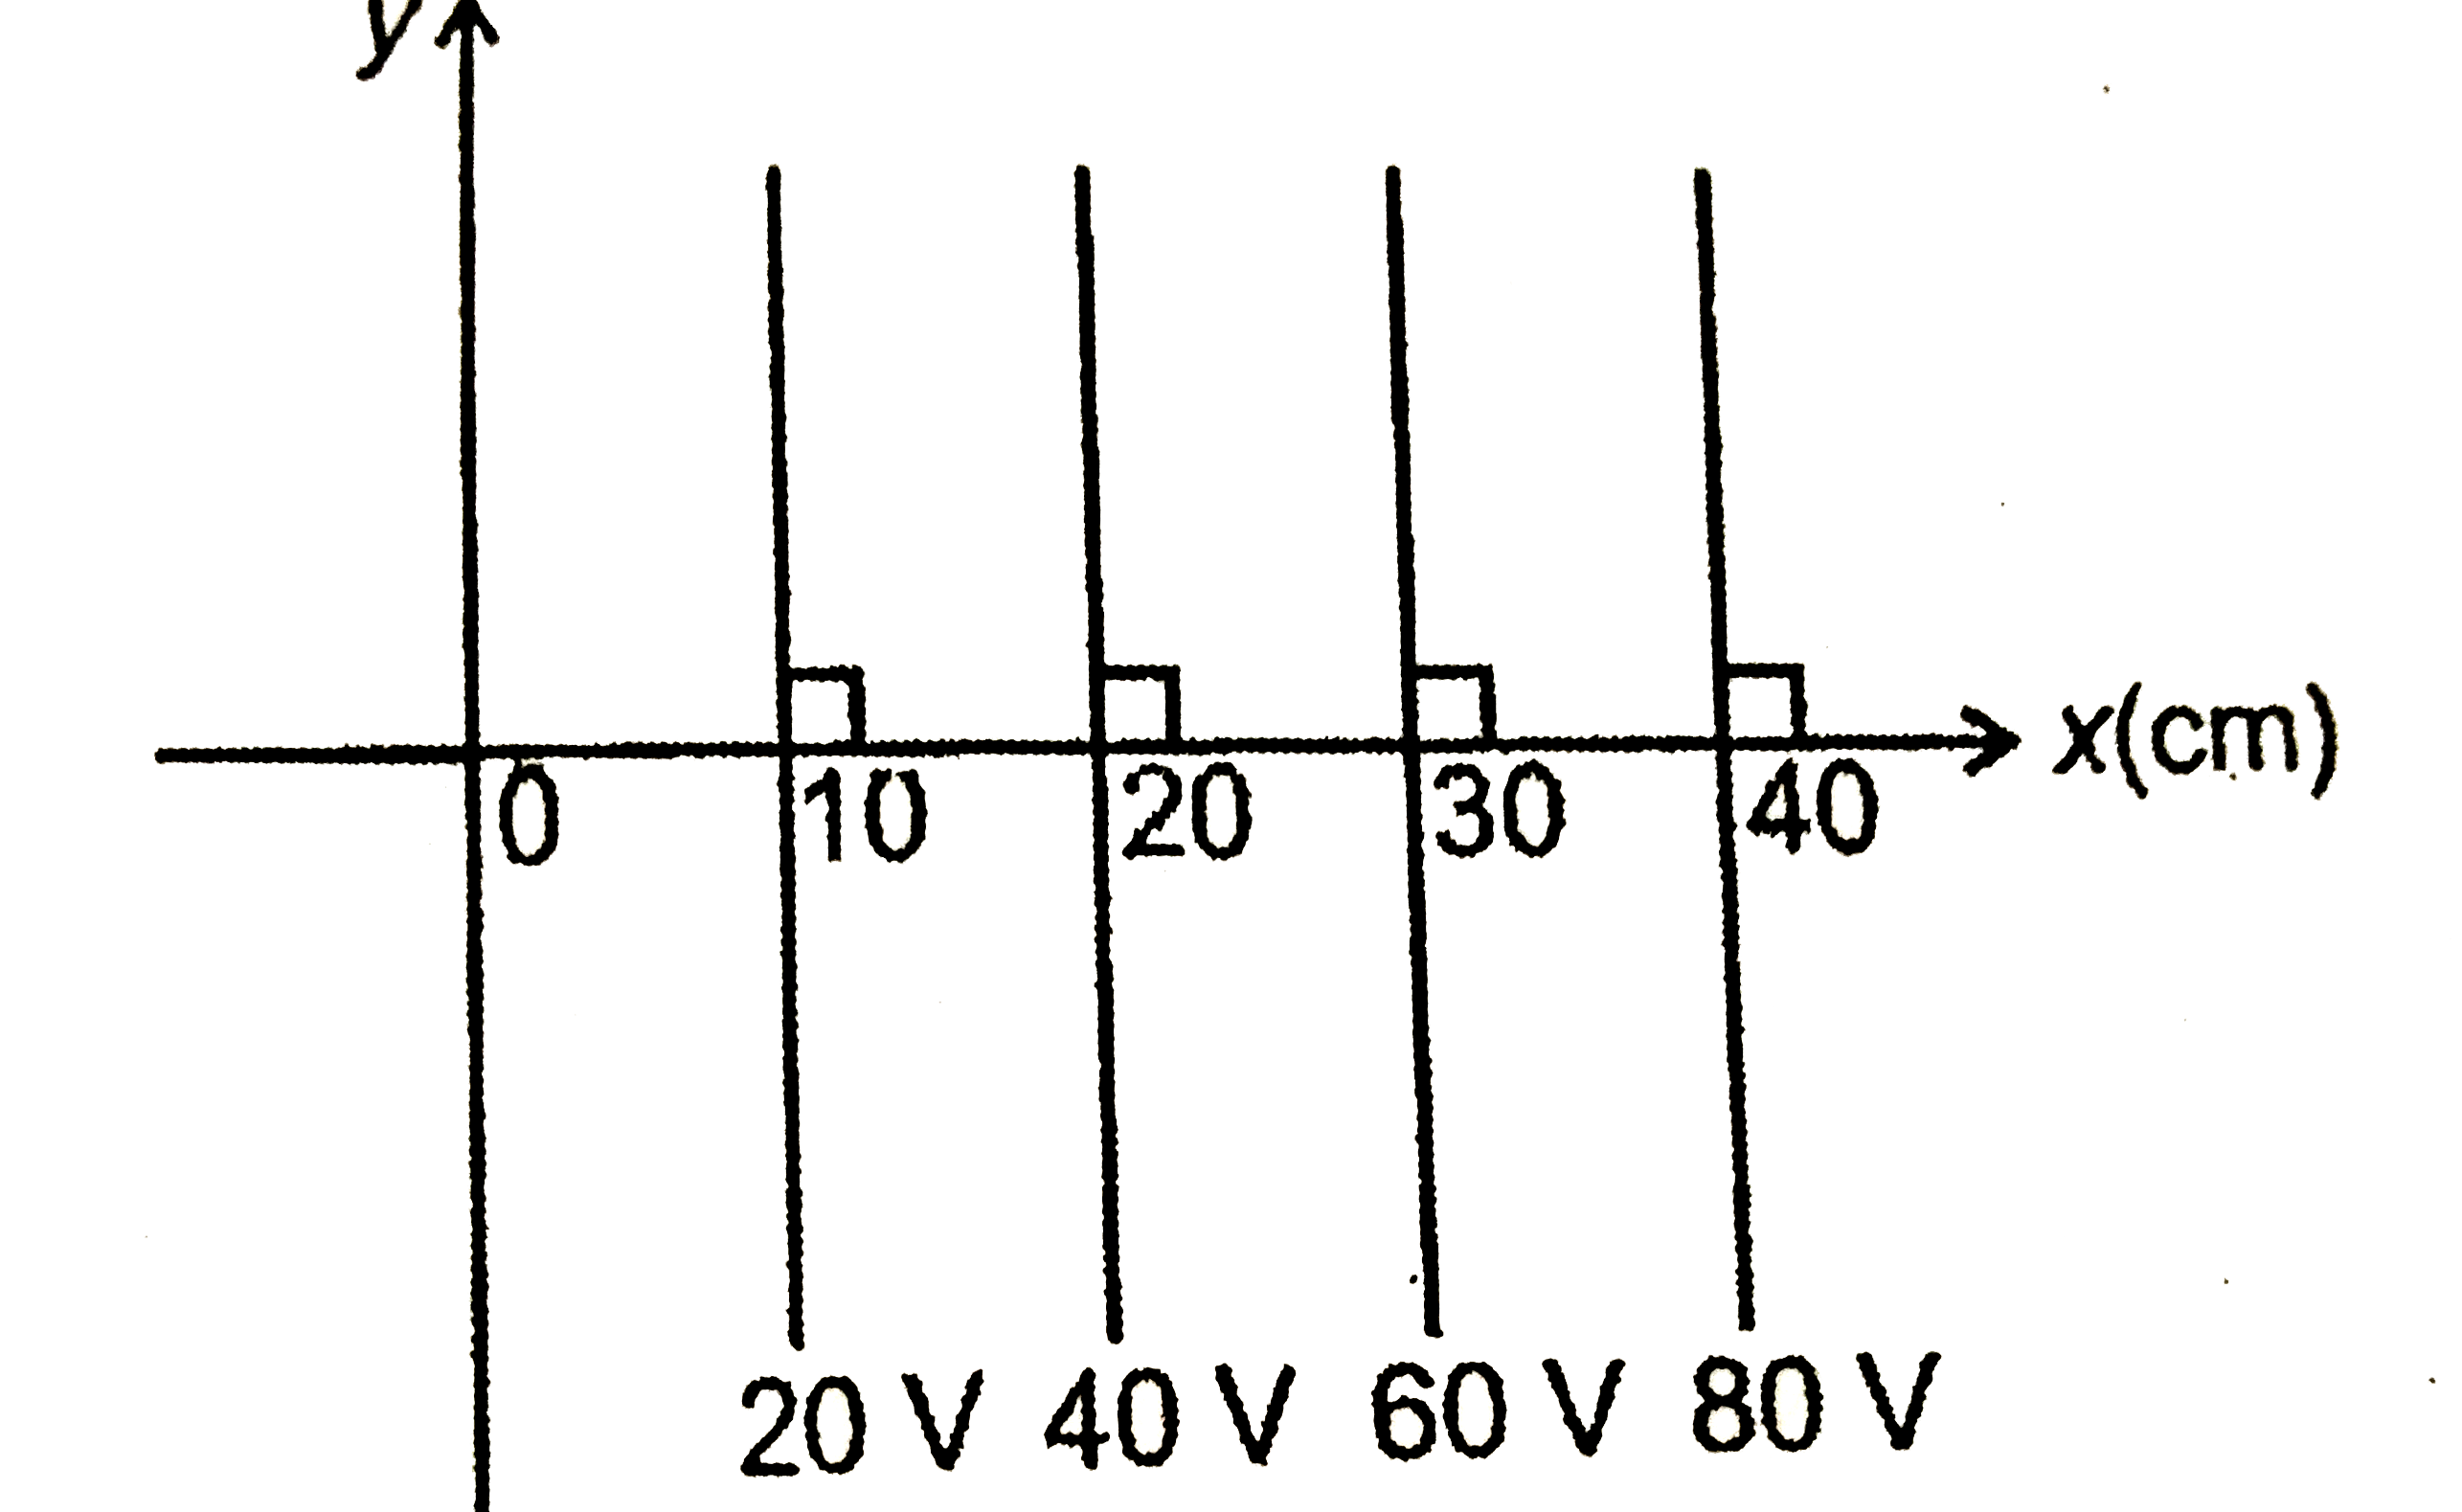
View SolutionFigure shows a set of equipotential surfaces. The magnitude and direction of electric field that exists in the region is-

View SolutionFigure shows a set of equipotential surfaces. The magnitude and direction of electric field that exists in the region is

View SolutionThe graph gives the magnitude B (t) of a uniform magnetic field that exists throughout a conducting loop, perpendicular to the plane of the loop. Rank the five regions of the graph according to the magnitude of the emf induced in the loop, greatest first

View Solution
