The following bar diagram shows the percentage of Hindus, Sikhs and Muslims in a state during the years from 2004 to 2007 . Examine the bar diagram and answer the following questions .
![The following bar diagram shows the percentage of Hindus, Sikhs and Muslims in a state during the years from 2004 to 2007 . Examine the bar diagram and answer the following questions . If the total population of the state in 2005 was 5 million. then the Hindu population was [1 million = 10,00,000]](https://d10lpgp6xz60nq.cloudfront.net/physics_images/KRN_SSC_CGL_QB_SET_19_E01_150_Q01.png)
If the total population of the state in 2005 was 5 million. then the Hindu population was [1 million = 10,00,000]
2000000
1250000
1500000
1750000
The correct Answer is:D
Step by step video, text & image solution for The following bar diagram shows the percentage of Hindus, Sikhs and Muslims in a state during the years from 2004 to 2007 . Examine the bar diagram and answer the following questions . If the total population of the state in 2005 was 5 million. then the Hindu population was [1 million = 10,00,000] by Maths experts to help you in doubts & scoring excellent marks in Class 14 exams.
Similar Questions
Given below is a bar diagram showing the percentage of Hindus, Sikhs and muslims in a state during the years 1989 to 1992.
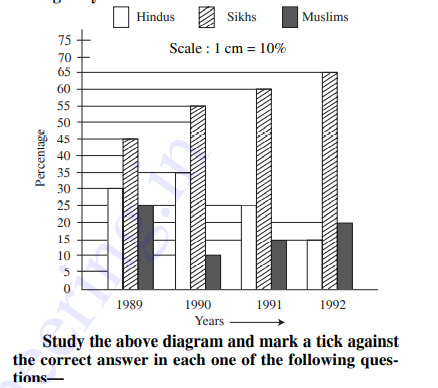
What percentage was the increase in Muslim populations from 1990 to 1992 ?View SolutionThe following bar diagram shows the percentage of Hindus, Sikhs and Muslims in a state during the years from 2004 o 2007. Examine the bar diagram and answer the following questions.
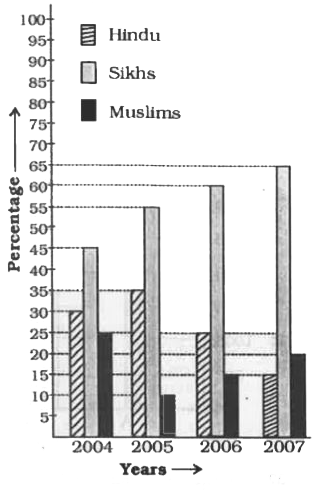
The ratio between the Hindus and Sikhs population in 2004 wasView Solution
Knowledge Check
- Question 1 - Select One
The following bar diagram shows the percentage of Hindus, Sikhs and Muslims in a state during the years from 2004 to 2007 . Examine the bar diagram and answer the following questions .
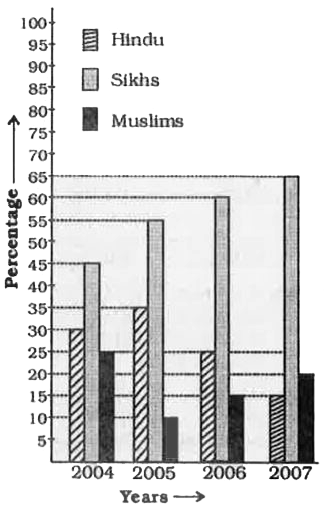
If the total population of the state in 2004 was 5 lakhs, then the Hindu and Muslim population in that year wasA200000B275000C250000D225000 - Question 2 - Select One
The following bar diagram shows the percentage of Hindus, Sikhs and Muslims in a state during the years from 2004 o 2007. Examine the bar diagram and answer the following questions.
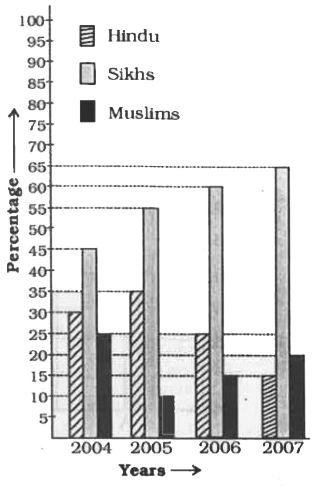
If the total population of the state in 2004 was 5 lakhs, then the Hindus and Muslims population in that year wasA200000B275000C250000D225000 - Question 3 - Select One
The following bar diagram shows the percentage of Hindus, Sikhs and Muslims in a state during the years from 2004 to 2007 . Examine the bar diagram and answer the following questions .
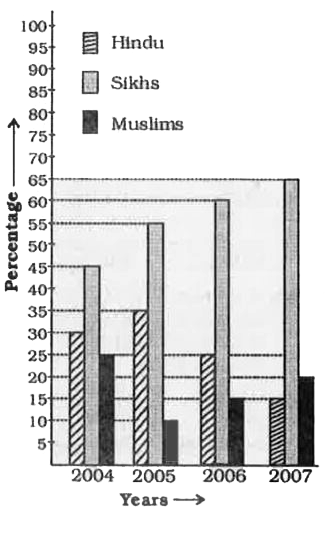
The ratio between the Hindus and Sikh populations in 2004 wasA3:5B1:2C2:3D3:4
Given below is a bar diagram showing the percentage of Hindus, Sikhs and muslims in a state during the years 1989 to 1992.
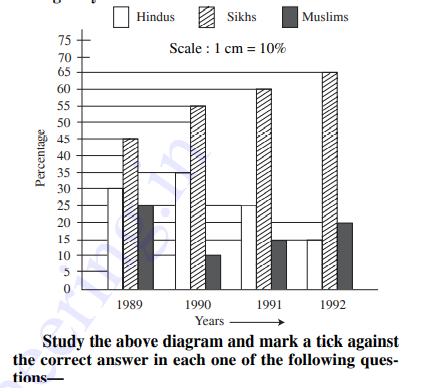
During which year was the hindu percentage maximum ?View SolutionGiven below is a bar diagram showing the percentage of Hindus, Sikhs and muslims in a state during the years 1989 to 1992.
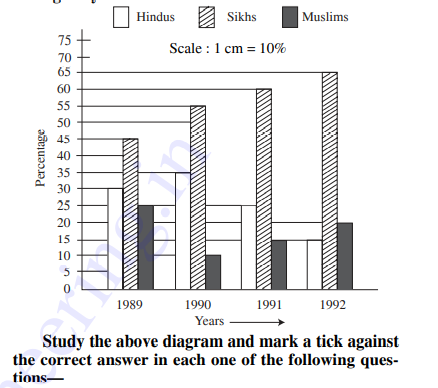
what was the percentage of sikhs over hindus in 1991 ?View SolutionGiven below is a bar diagram showing the percentage of Hindus, Sikhs and muslims in a state during the years 1989 to 1992.
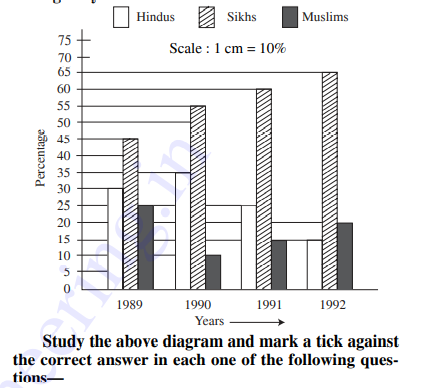
The ratio between hindus and sikhs in 1989 was-----View SolutionGiven below is a bar diagram showing the percentage of Hindus, Sikhs and muslims in a state during the years 1989 to 1992.
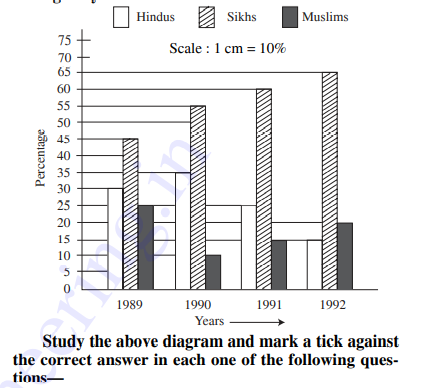
What percentage was the decrease in hindus population from 1989 to 1992 ?View SolutionGiven below is a bar diagram showing the percentage of Hindus, Sikhs and muslims in a state during the years 1989 to 1992.
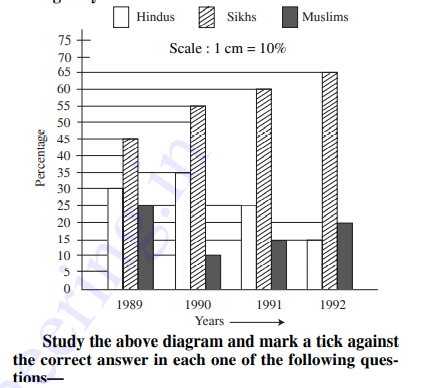
If the total population of the state in 1990 is 1 million, then the hindus population was -----View Solution

