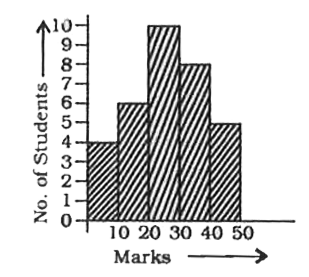
Study the following Histogram and answer the following questions.
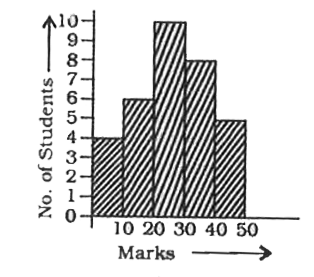
The least number of students got the marks in the interval
40−50
20−30
10−20
0−10
The correct Answer is:D
Step by step video, text & image solution for Study the following Histogram and answer the following questions. The least number of students got the marks in the interval by Maths experts to help you in doubts & scoring excellent marks in Class 14 exams.
Similar Questions
Study the following histogram and answer the given question.
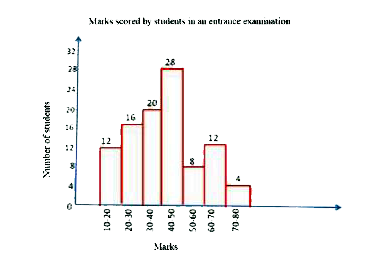
What is the ratio of the number of students who scored 30 or more marks, but below 40 marks, to the total number of students in the entrance examination?View SolutionStudy the following table and answer the questions.

The total number of students scoring 50% or more marks isView Solution
Knowledge Check
- Question 1 - Select One
Study the following Histogram and answer the following questions.
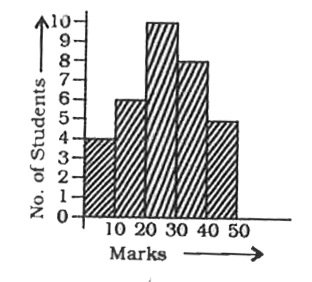
The maximum number of students got the marks in the Interval ofA10−20B20−30C30−40D40−50 - Question 2 - Select One
Study the following Histogram and answer the following questions.
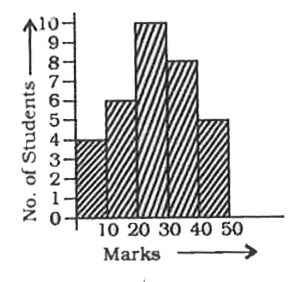
The total number of students involved in the data isA33B32C43D42 - Question 3 - Select One
Study the following Histogram and answer the following questions.
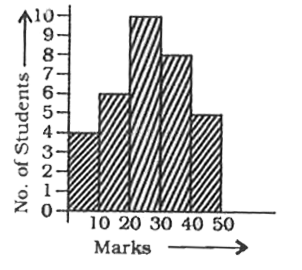
The ratio of the students obtaining marks in the first and the last interval isA5:4B6:5C4:5D3:4
Study the following Histogram and answer the following questions.
The difference in the amount estimated by the family on interior decoration and architect's fees isView SolutionStudy the following histogram and answer the questions.
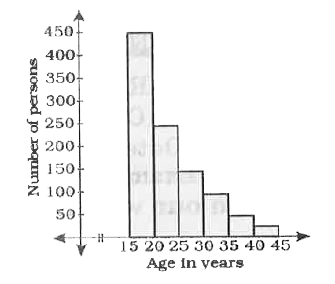
The number of persons in the age group 20 - 30 years is :View SolutionStudy the following data and answer the questions.

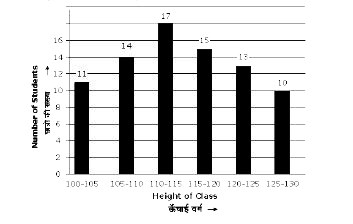
The number of students whose IQ score is 100 and more isView SolutionIn the given histogram, what is the mean height of all students to one decimal place.
 View Solution
Study the following table and answer the questions.

The ratio of the total number of students scoring marks less than 50% to that of scoring marks exactly 50% isView Solution

