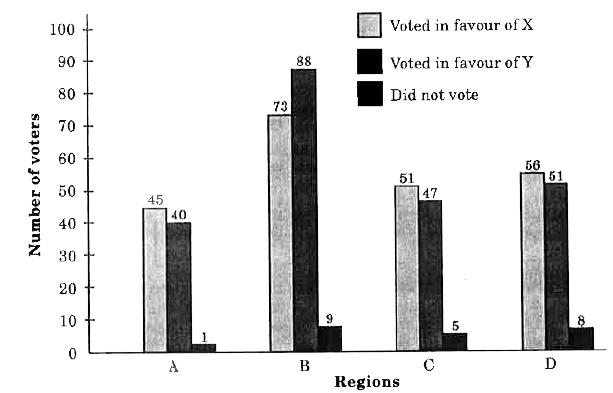
A constituency is divided in four regions A,B,C and D . Two candidates X and Y contested the last election from that constituency . The adjoining graph gives the break - up of voting in the four regions . Study graph and answer the following questions .
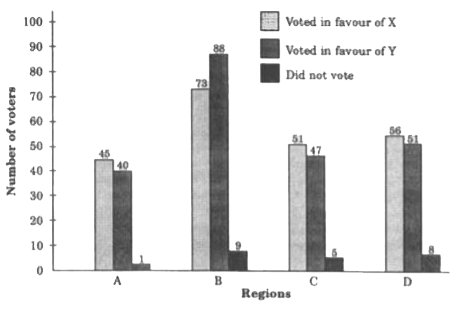
Approximately how much percent of voters did not caste their votes?
4.9
4.5
0.23
23
The correct Answer is:A
Step by step video, text & image solution for A constituency is divided in four regions A,B,C and D . Two candidates X and Y contested the last election from that constituency . The adjoining graph gives the break - up of voting in the four regions . Study graph and answer the following questions . Approximately how much percent of voters did not caste their votes? by Maths experts to help you in doubts & scoring excellent marks in Class 14 exams.
Similar Questions
Direction: A shopkeeper sells four articles A, B, C and D. The Bar graph shows the Cost price (In Rs.) of the articles and Profit/loss percentage realized by the shopkeeper while selling these articles. Study the following bar graph carefully and answer the following questions.
If the article B is first sold at loss to one customer at Rs. X and then at profit to another customer at Rs. Y, then find by how much percent Y is greater than X.View SolutionDirection: A shopkeeper sells four articles A, B, C and D. The Bar graph shows the Cost price (In Rs.) of the articles and Profit/loss percentage realized by the shopkeeper while selling these articles. Study the following bar graph carefully and answer the following questions.
If the selling price of article A is 72% of the selling price of article D then which of the following is correct?View Solution
Knowledge Check
- Question 1 - Select One
A constituency is divided in four regions A,B,C and D . Two candidates X and Y contested the last election from that constituency . The adjoining graph gives the break - up of voting in the four regions . Study graph and answer the following questions .

Approximately how much percent of voted in favour of X ?A45.4B47.5C50D225 - Question 2 - Select One
A constituency is divided in four regions A, B, C and D. Two candidates X and Y contested last election from that constituency. The adjoining graph given the break-up of voting in the four regions. Study the graph and answer the following questions.
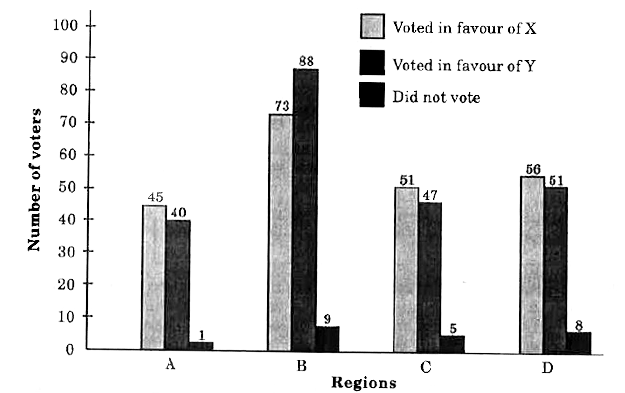
Approximately how much percent of voter did not caste their votes?A4.9B4.5C0.23D2.3 - Question 3 - Select One
A constituency is divided in four regions A, B, C and D. Two candidates X and Y contested last election from that constituency. The adjoining graph given the break-up of voting in the four regions. Study the graph and answer the following questions.
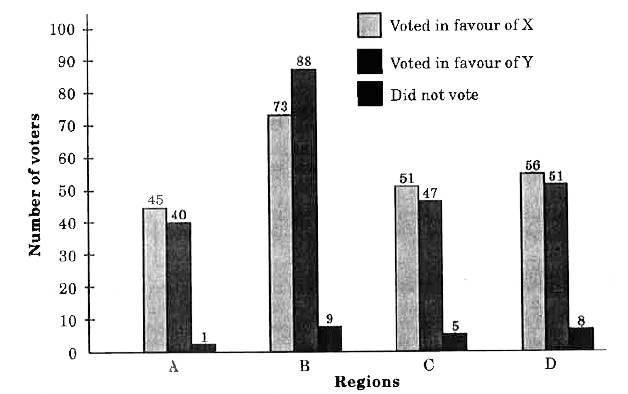
Approximately how much percent of voters voted in favour of X?A45.4B47.5C50D225
Direction: A shopkeeper sells four articles A, B, C and D. The Bar graph shows the Cost price (In Rs.) of the articles and Profit/loss percentage realized by the shopkeeper while selling these articles. Study the following bar graph carefully and answer the following questions.
If Article C is sold at loss and its marked price is Rs. 264, then find the difference between percentage discount and percentage markup of the article.View SolutionA constituency is divided in four regions A,B,C and D . Two candidates X and Y contested the last election from that constituency . The adjoining graph gives the break - up of voting in the four regions . Study graph and answer the following questions .

Nearly what percentage of the total votes did X receive from region B ?View SolutionA constituency is divided in four regions A,B,C and D . Two candidates X and Y contested the last election from that constituency . The adjoining graph gives the break - up of voting in the four regions . Study graph and answer the following questions .
 In region B ,Y gets A% more votes than X , find the value of A. View Solution
A constituency is divided in four regions A, B, C and D. Two candidates X and Y contested last election from that constituency. The adjoining graph given the break-up of voting in the four regions. Study the graph and answer the following questions.
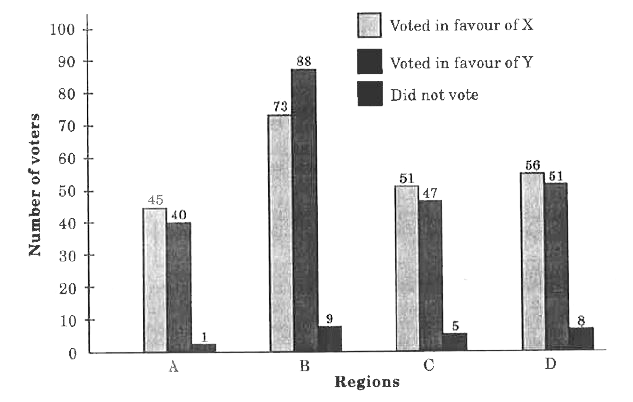
Nearly what percentage of his total votes did X receive from region B?View SolutionA constituency is divided in four regions A, B, C and D. Two candidates X and Y contested last election from that constituency. The adjoining graph given the break-up of voting in the four regions. Study the graph and answer the following questions.
In region B, Y get A% more votes than X. Find the value of A.View Solution

