The table shows the number of students from different schools playing different games. Study the table carefully and answer the questions.
Games Schools A B C DCricket 125 250 150 175Football 175 200 250 125Hockey 75 125 200 150
What is the average of the number of students who play cricket in all four schools ?
180
200
190
175
Step by step video, text & image solution for The table shows the number of students from different schools playing different games. Study the table carefully and answer the questions. {:("Games Schools"),(" A B C D"),("Cricket 125 250 150 175"),("Football 175 200 250 125"),("Hockey 75 125 200 150"):} What is the average of the number of students who play cricket in all four schools ? by Maths experts to help you in doubts & scoring excellent marks in Class 14 exams.
Similar Questions
Knowledge Check
- Question 1 - Select One
The table shows the number of students from different schools playing different games. Study the table carefully and answer the questions.
Games Schools A B C DCricket 125 250 150 175Football 175 200 250 125Hockey 75 125 200 150
What is the ratio of the total students who play cricket in schools A and B together to the total students who play hockey in schools D and B together ?A15:13B15:11C16:11D16:13 - Question 2 - Select One
The table shows the number of students from different schools playing different games. Study the table carefully and answer the questions.
Games Schools A B C DCricket 125 250 150 175Football 175 200 250 125Hockey 75 125 200 150
If the data about the number of students who play hockey from different school is represented by a pir-chart, what is the central angle of the sector representing students who play hockey from school C to the nearest whole number ?A80∘B131∘C102∘D95∘ - Question 3 - Select One
The table shows the number of students from different schools playing different games. Study the table carefully and answer the questions.
Games Schools A B C DCricket 125 250 150 175Football 175 200 250 125Hockey 75 125 200 150
The number of students who play football in school A is approximately what percent of the football playing students from all schools ?A19.4B19.7C19.9D23.33
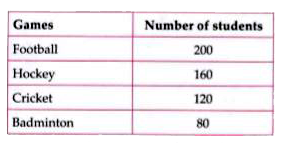
The following table shows the interest of students of a school in different games :

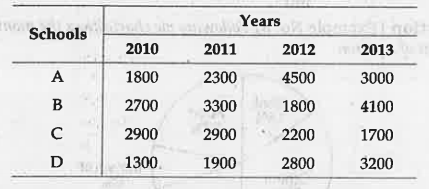
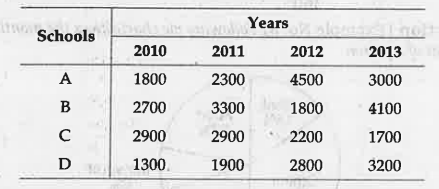
Represent the data by using a simple bar diagram.View SolutionFollowing table shows the number of students studying in four different schools in four years. Studying the table carefully and answer the questions that follow

Which scholls has highest number of students in all the years together?View SolutionFollowing table shows the number of students studying in four different schools in four years. Studying the table carefully and answer the questions that follow

What is the total number of students studying in all the four schools together in the year 2012?View SolutionWhy students should play games in school ?
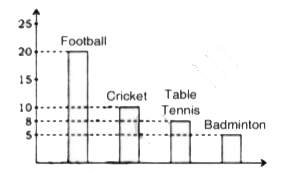
View SolutionThe following bar graph shows the games played by the students. Study the graph carefully and answer the question given below:

How many students play table tennis?View Solution


