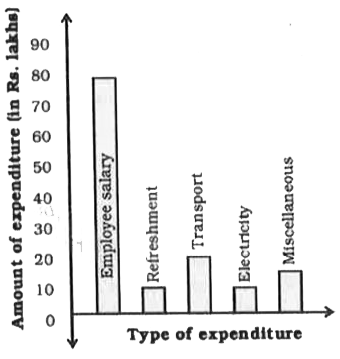
The bar diagram shows the monthly expenditure of a company. Study the graph and answer the questions.
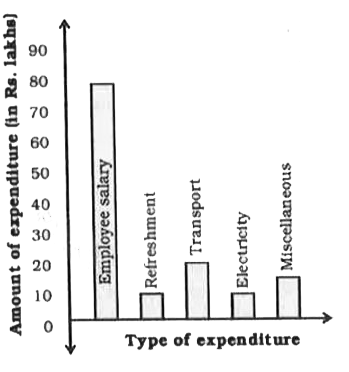
The ratio between expenditure on transport and employee salary on monthly basis is :
1:4
4:3
3:4
4:1
The correct Answer is:A
Step by step video, text & image solution for The bar diagram shows the monthly expenditure of a company. Study the graph and answer the questions. The ratio between expenditure on transport and employee salary on monthly basis is : by Maths experts to help you in doubts & scoring excellent marks in Class 14 exams.
Updated on:21/07/2023Similar Questions
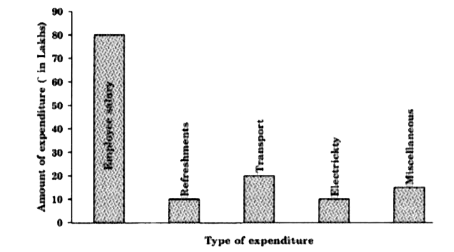
The graph shows the monthly expenditure of a company (unit = 10 lakhs). Study the graph and answer the questions :
The ratio between transport and employee salary on monthly basis is
ग्राफ में किसी कम्पनी के मासिक व्यय को दर्शाया गया है। ग्राफ का अध्ययन कीजिए और निम्नलिखित प्रश्नों के उत्तर दीजिए।
मासिक आधार पर परिवहन और कर्मचारियों के वेतन के बीच अनुपात कितना है ?
View SolutionThe graph shows Income and Expenditure of a company. Study the graph and answer the questions.
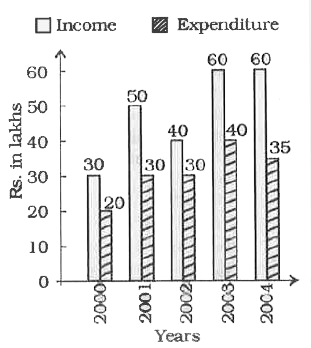
The profit was maximum in the year
View Solution
Knowledge Check
The bar diagram shows the monthly expenditure of a company. Study the graph and answer the questions.
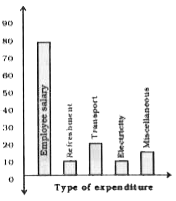
The ratio between expenditure on transport and employees salary on monthly basis is :A1:4B4:3C3:4D4:1The bar diagram shows the monthly expenditure of a company. Study the graph and answer the questions.
The total monthly expenditure of the company is :ARs. 153 lakhsBRs. 315 lakhsCRs. 135 lakhsDRs. 531 lakhsThe bar diagram shows the monthly expenditure of a company. Study the graph and answer the questions.
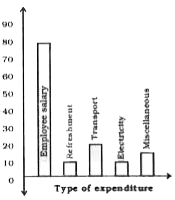
The total monthly expenditure of the company is :ARs. 153 lakhsBRs. 315 lakhsCRs. 135 lakhsDRs. 531 lakhs
The graph shows Income and Expenditure of a company. Study the graph and answer the questions.
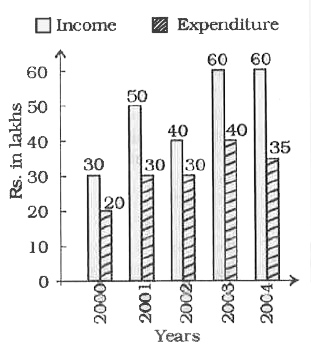
The expenditure from 2002 to 2003 increased by
View SolutionThe bar diagram shows the monthly expenditure of a company. Study the graph and answer the questions.
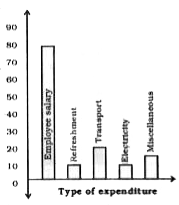
The fraction of money spent on refreshment is :
View SolutionThe bar diagram shows the monthly expenditure of a company. Study the graph and answer the questions.
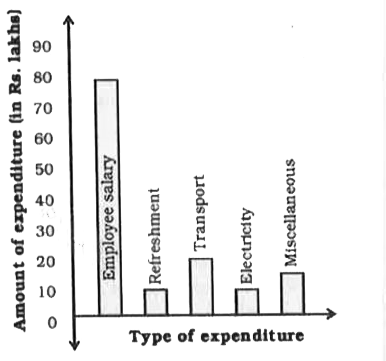
The fraction of money spent on refreshment is:
View SolutionThe bar diagram shows the monthly expenditure of a company. Study the graph and answer the questions.
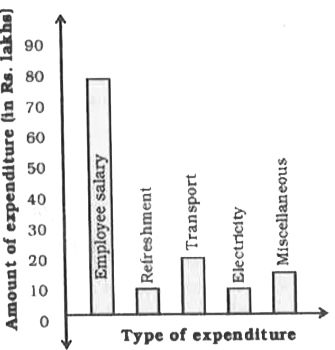
The percentage of money spent on miscellaneous is
View SolutionThe bar diagram shows the monthly expenditure of a company. Study the graph and answer the questions.
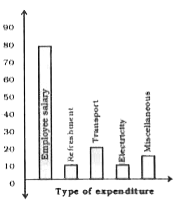
The percentage of money spent on miscellaneous is
View Solution
