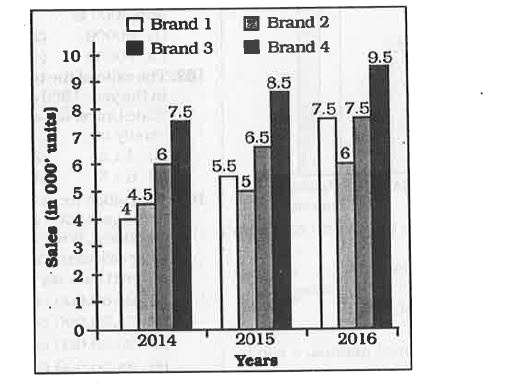
The bar chart given below shows the sales (in '000 units) of 4 mobile brands for 3 years.
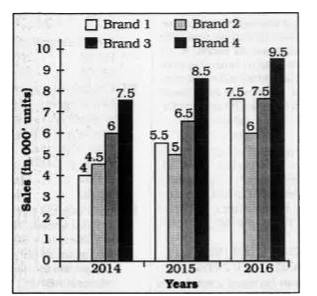
What is the percentage increase in the number of mobile phones of Brand 2 sold from 2014 to 2015?
8.33
33.33
37.5
11.11
The correct Answer is:D
Step by step video, text & image solution for The bar chart given below shows the sales (in '000 units) of 4 mobile brands for 3 years. What is the percentage increase in the number of mobile phones of Brand 2 sold from 2014 to 2015? by Maths experts to help you in doubts & scoring excellent marks in Class 14 exams.
Updated on:21/07/2023Similar Questions
The bar chart given below shows the sales (in crores ) of company P from years 2009 to 2015 .
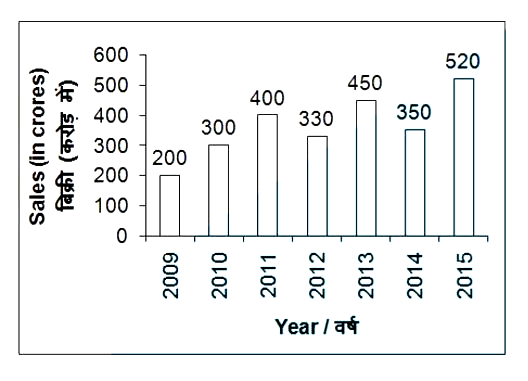
What is the percentage change in the sale from year 2009 to 2013?
View SolutionThe bar chart given below shows the sales ( in crores) of company P from years 2009 to 2015.
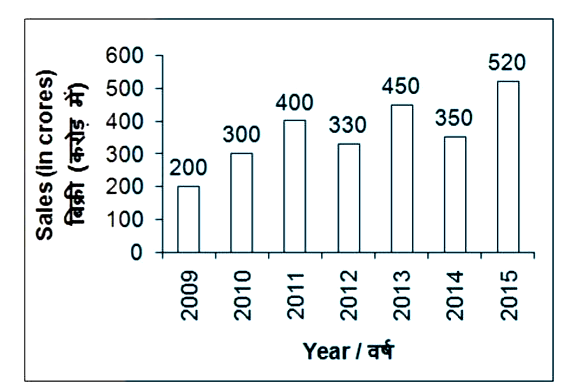
What is the percentage change in sales from year 2010 to 2014?
View Solution
Knowledge Check
The bar chart given below shows the sales (in '000 units) of 4 mobile brands for 3 years.
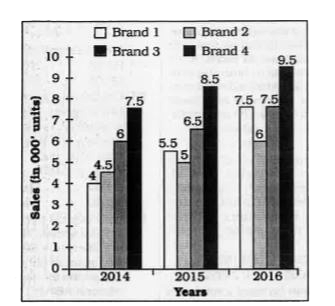
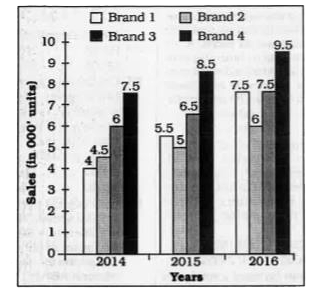
What is the percentage increase in the total number of mobiles sold by these four brands from 2014 to 2016?A42.16B38.63C32.43D30.16The bar chart given below shows the sales (in '000 units) of 4 mobile brands for 3 years.
What is the percentage increase in the total number of mobiles sold by these four brands from 2014 to 2016?A42.16B38.63C32.43D30.16The bar chart given below shows the sales (in '000 units) of 4 mobile brands for 3 years.
In 2017 the sales of each brand increased by the same percentage as it did in the year 2016. What will be the approximate average sales (in units) of mobiles per brand in year 2017?A9175B8360C9436D9678
The bar chart given below shows the sales (in '000 units) of 4 mobile brands for 3 years.
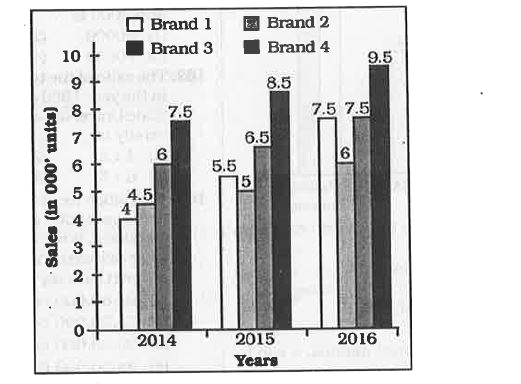
In 2017 the slaes of each brand increased by the same percentage as it did in the approximate average sales (in units) of mobiles per brand in year 2017?
View SolutionThe bar chart given below shows the number of cars sold by brand A and B for the year for 2008 to 2016
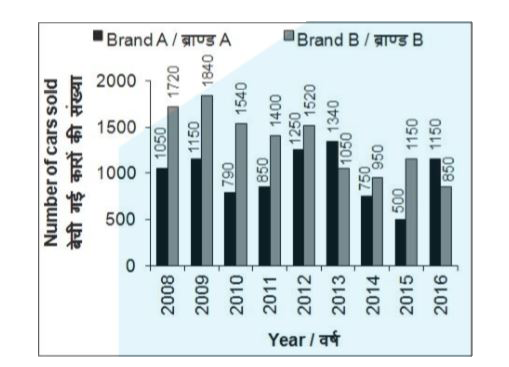
What is the percentage decrease in the number of car sold in year 2015 from year 2014 for brand A?
View SolutionThe bar chart given below shows the sales (in '000 units) of 4 mobile brands for 3 years.
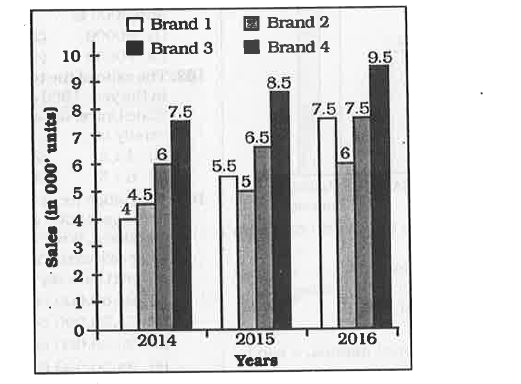
If for anby year, the sales of a brand is more than average sales of these four brands in that year, then it gets a star. Which brand has the maximum stars?
View SolutionThe bar chart given below shows the sales (in '000 units) of 4 mobile brands for 3 years.
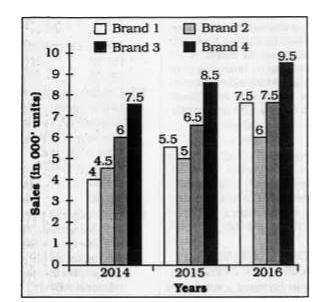
If for any year, the scales of a brand is more than average sales of these four brands in that year, then it gets a star. Which brand has the maximum stars?
View SolutionThe bar chart given below shows thes sales (in lacs) of 2 companies X and Y from year 2011 to 2016
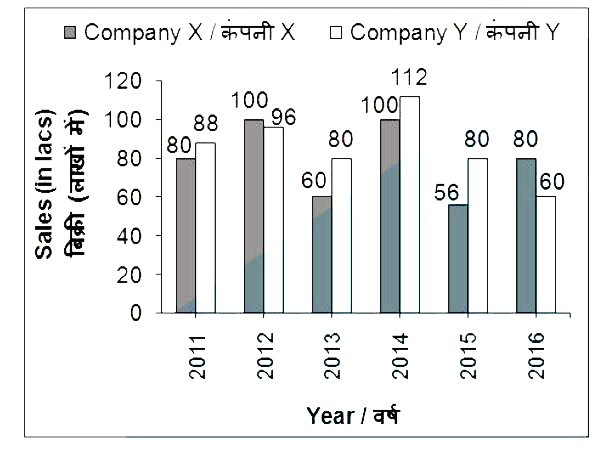
What was the percentage change in the sale of company X from year 2011 to 2015?
View Solution
