An open switch in an RL circuit is closed at time t = 0, as shown in the following figure. The curve that best illustrates the variation of potential difference across the resistor as a function of time is
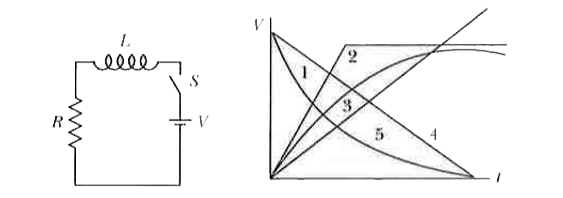
1
2
3
4
The correct Answer is:C
Topper's Solved these Questions
- ELECTROMAGNETIC INDUCTIONBook:RESNICK AND HALLIDAYChapter:ELECTROMAGNETIC INDUCTIONExercise:PRACTICE QUESTIONS (More than One Correct Choice Type)
Explore 13 Videos
- ELECTROMAGNETIC INDUCTIONBook:RESNICK AND HALLIDAYChapter:ELECTROMAGNETIC INDUCTIONExercise:PRACTICE QUESTIONS (Linked Comprehension)
Explore 19 Videos
- ELECTROMAGNETIC INDUCTIONBook:RESNICK AND HALLIDAYChapter:ELECTROMAGNETIC INDUCTIONExercise:PROBLEMS
Explore 67 Videos
- ELECTRIC POTENTIALBook:RESNICK AND HALLIDAYChapter:ELECTRIC POTENTIALExercise:(PRACTICE QUESTIONS) Integer Type
Explore 1 Video
- ELECTROMAGNETIC OSCILLATIONS AND ALTERNATING CURRENT Book:RESNICK AND HALLIDAYChapter:ELECTROMAGNETIC OSCILLATIONS AND ALTERNATING CURRENT Exercise:Practice Questions (Integer)
Explore 7 Videos
Similar Questions
In the circuit shown in figure switch S is closed at time t=0
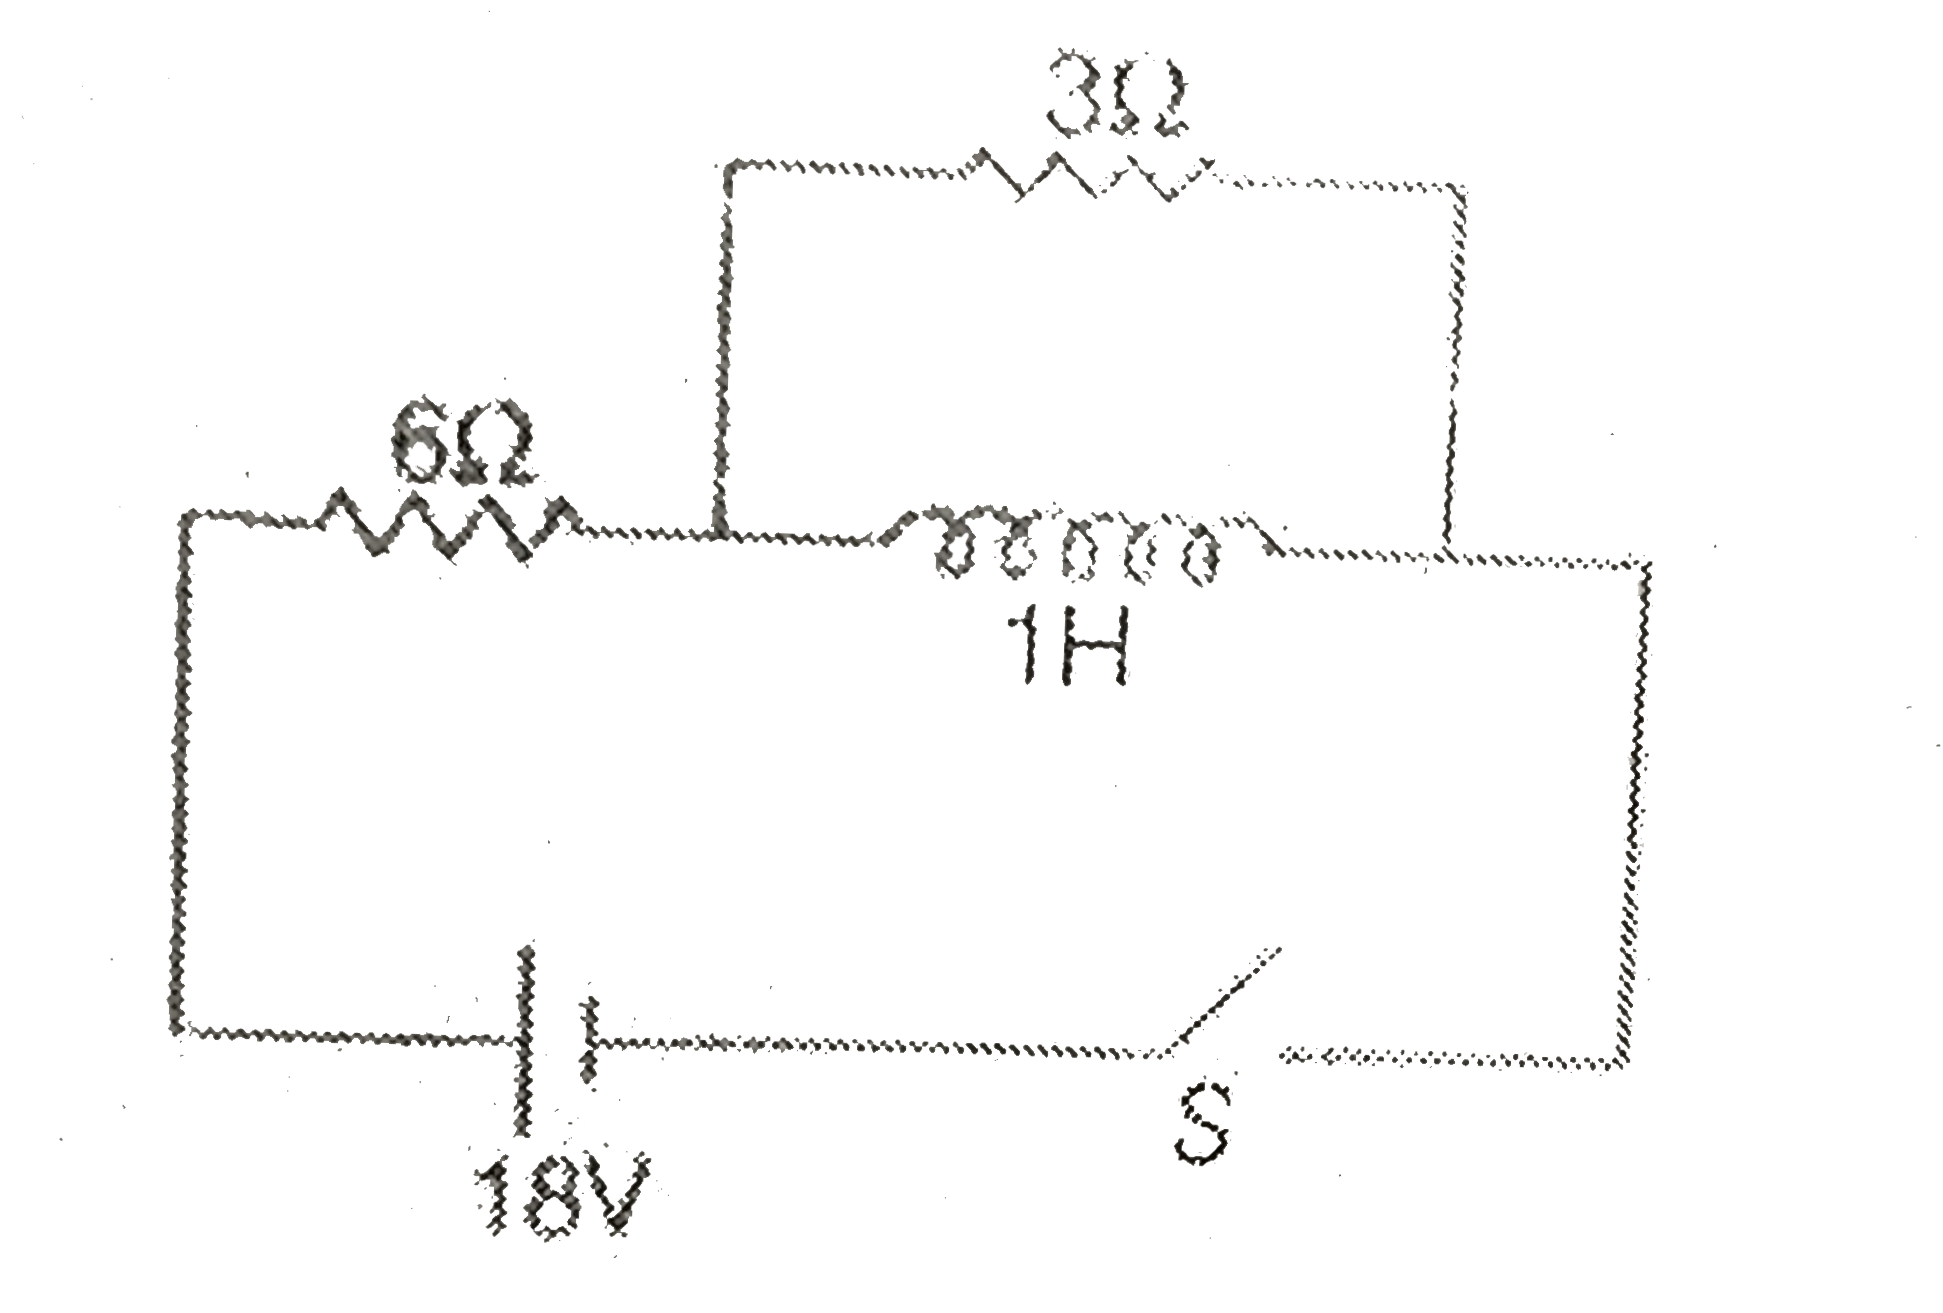
Potential difference across 3Ω resistance at time t is given by
View SolutionA constant voltage of 25 V is applied to a series L-R circuit at t = 0, by closing a switch. What is the potential difference across the resistor and the inductor at time t = 0?
View Solution
Knowledge Check
In the circuit shown in figure switch S is closed at time t=0

Potential difference across 3Ω resistance at time t is given byA9e−21B6e−2tC3e−2tD18(1−e−t/9)In the circuit shown in the following figure, the switch is moved to position 1 at t = 0. Which of the following most closely represents the current I as a function of time?
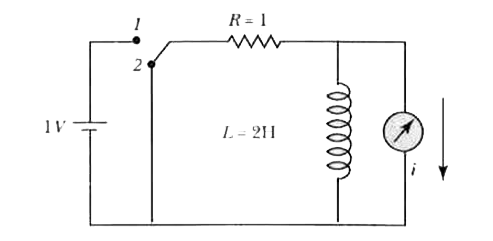 A
A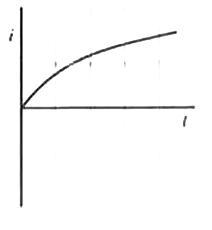 B
B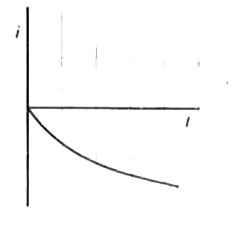 C
C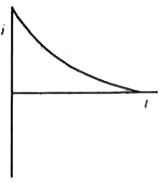 D
D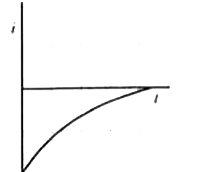
In the circuit shown in figure, circuit is closed at time t=0. At time t=ln(2) second
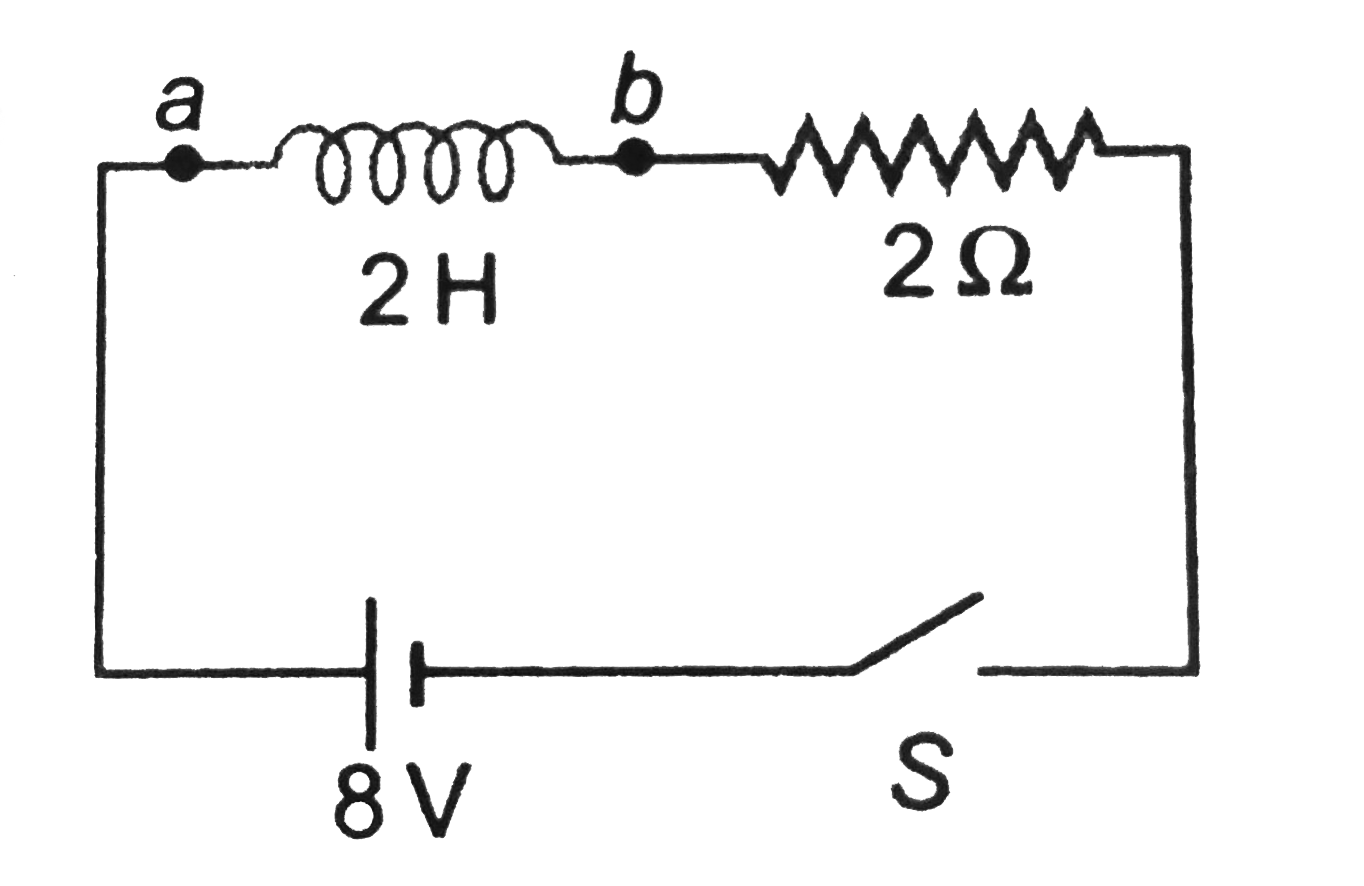 Arate of energy supplied by the battery is 16 J/sBrate of heat dissipated across resistance is 8J/sCrate of heat dissipated across resistance is 16 J/sDVa−Vb=4V
The switch in figure is closed at time t=0. Find the current in the inductor and the current through the switch as functions of time thereafter.
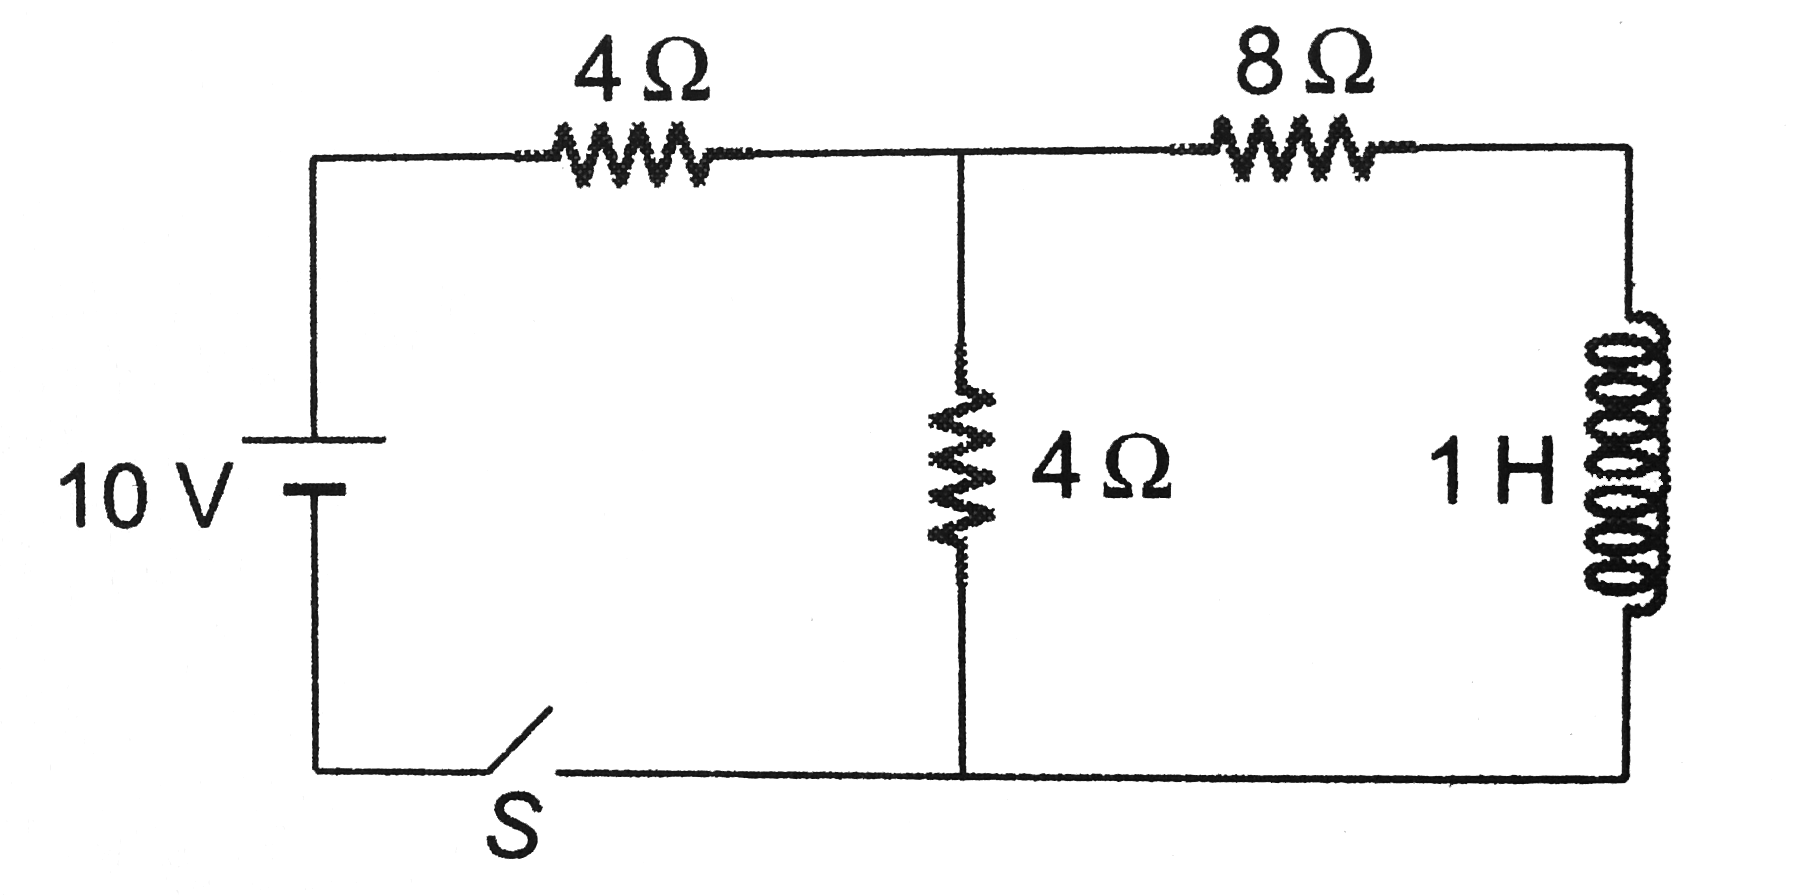
View SolutionThe switch in figure is closed at time t=0. Find the current in the inductor and the current through the switch as functions of time thereafter.

View SolutionIn the circuit shown in figure, circuit is closed at time t=0. At time t=ln(2) second

View SolutionThe switch shown n the figure is closed at t=0. The charge on the capacitor as a function of time is given by
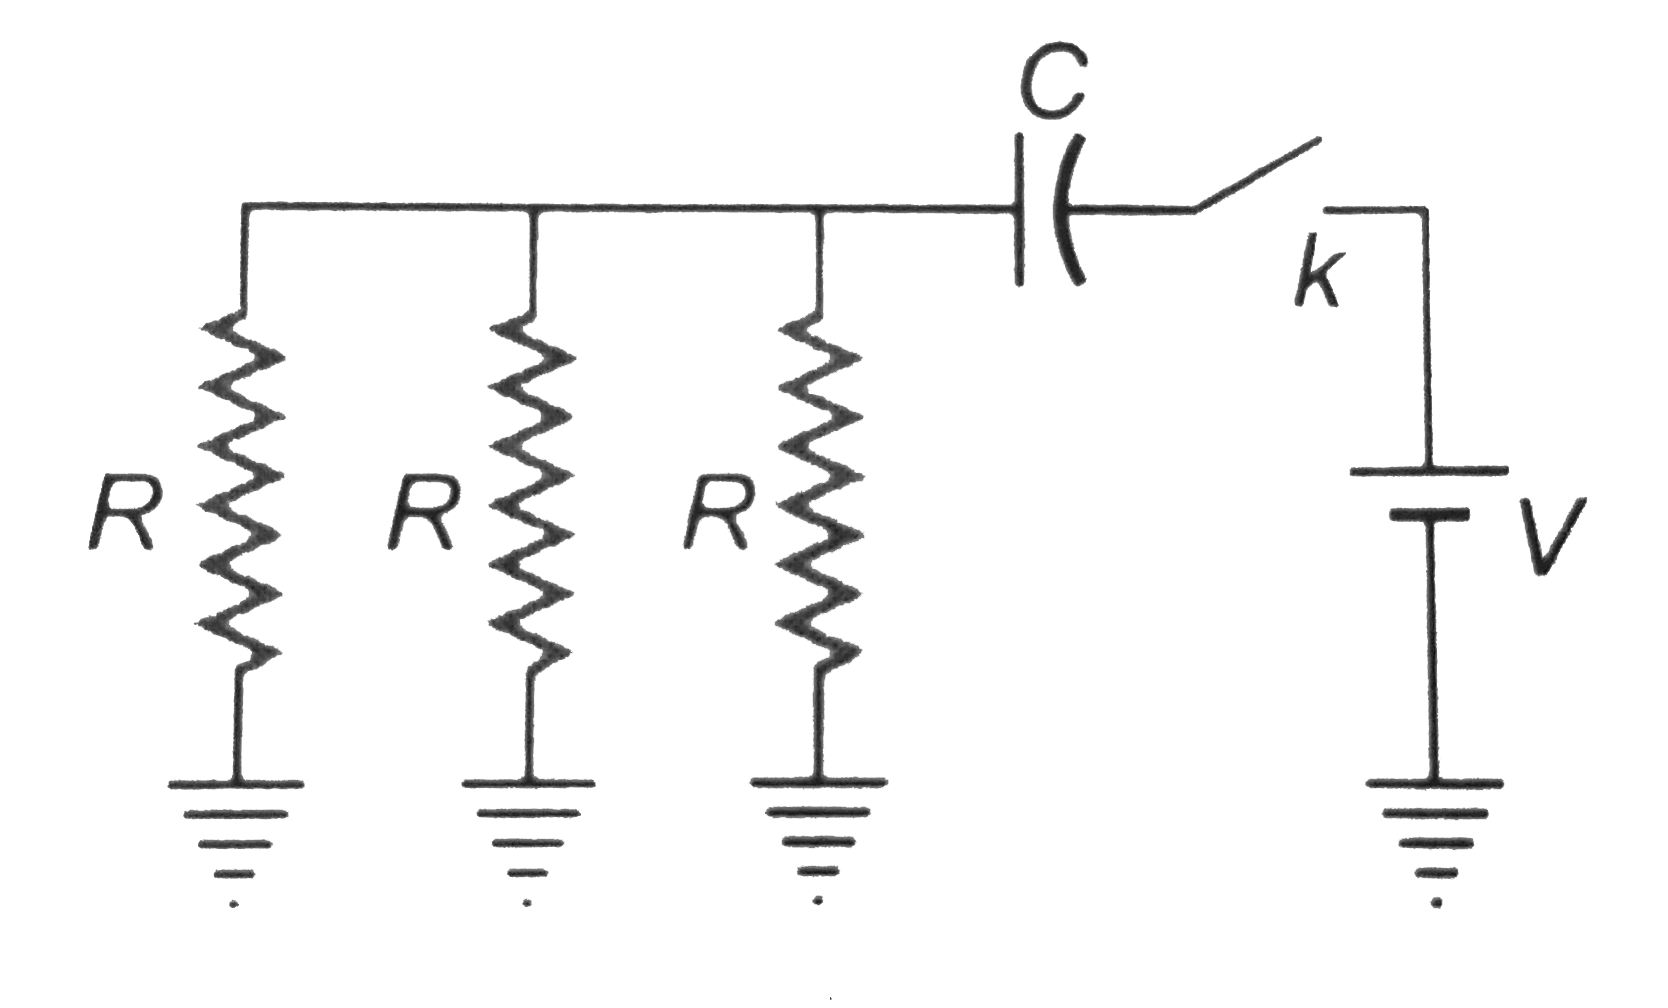
View SolutionThe switch shown n the figure is closed at t=0. The charge on the capacitor as a function of time is given by

View Solution
