Draw a pie chart showing the following information. The table shows the colours preferred by a group of people. Colours Nubers of people Blue 18, Green 9, Red 6, Yellow 3, and Tatal 36
To draw a pie chart based on the given data about the preferred colors of a group of people, we need to follow these steps:
Step 1: Understand the Data
We have the following data:
- Blue: 18 people
- Green: 9 people
- Red: 6 people
- Yellow: 3 people
- Total: 36 people
Step 2: Calculate the Central Angle for Each Color
The central angle for each color in a pie chart can be calculated using the formula:
Central Angle=(Number of People for ColorTotal Number of People)×360∘
Now, we will calculate the central angle for each color:
1. Blue:
Central Angle for Blue=(1836)×360=0.5×360=180∘
2. Green:
Central Angle for Green=(936)×360=0.25×360=90∘
3. Red:
Central Angle for Red=(636)×360=0.1667×360≈60∘
4. Yellow:
Central Angle for Yellow=(336)×360=0.0833×360≈30∘
Step 3: Summarize the Central Angles
- Blue: 180°
- Green: 90°
- Red: 60°
- Yellow: 30°
Step 4: Draw the Pie Chart
1. Draw a circle to represent the pie chart.
2. Start from the top (12 o'clock position) and draw the first sector for Blue (180°). This will cover half of the circle.
3. Next, draw the sector for Green (90°). This will be a quarter of the circle.
4. Then, draw the sector for Red (60°). This will be one-sixth of the circle.
5. Finally, draw the sector for Yellow (30°). This will be one-twelfth of the circle.
Step 5: Label Each Sector
Label each sector with the corresponding color and the number of people who prefer that color.
Final Pie Chart
You should now have a pie chart that visually represents the color preferences of the group of people.
---
We have the following data:
- Blue: 18 people
- Green: 9 people
- Red: 6 people
- Yellow: 3 people
- Total: 36 people
The central angle for each color in a pie chart can be calculated using the formula:
Central Angle=(Number of People for ColorTotal Number of People)×360∘
Central Angle for Blue=(1836)×360=0.5×360=180∘
Central Angle for Green=(936)×360=0.25×360=90∘
Central Angle for Red=(636)×360=0.1667×360≈60∘
Central Angle for Yellow=(336)×360=0.0833×360≈30∘
- Blue: 180°
- Green: 90°
- Red: 60°
- Yellow: 30°
1. Draw a circle to represent the pie chart.
2. Start from the top (12 o'clock position) and draw the first sector for Blue (180°). This will cover half of the circle.
3. Next, draw the sector for Green (90°). This will be a quarter of the circle.
4. Then, draw the sector for Red (60°). This will be one-sixth of the circle.
5. Finally, draw the sector for Yellow (30°). This will be one-twelfth of the circle.
Label each sector with the corresponding color and the number of people who prefer that color.
You should now have a pie chart that visually represents the color preferences of the group of people.
Topper's Solved these Questions
- DATA HANDLINGBOOK - NCERTCHAPTER - DATA HANDLINGEXERCISE - EXERCISE 5.1
5 Videos
- DATA HANDLINGBOOK - NCERTCHAPTER - DATA HANDLINGEXERCISE - SOLVED EXAMPLES
1 Videos
- CUBES AND CUBE ROOTSBOOK - NCERTCHAPTER - CUBES AND CUBE ROOTSEXERCISE - EXERCISE 7.1
4 Videos
- DIRECT AND INVERSE PROPORTIONSBOOK - NCERTCHAPTER - DIRECT AND INVERSE PROPORTIONSEXERCISE - SOLVED EXAMPLES
8 Videos
Similar Questions
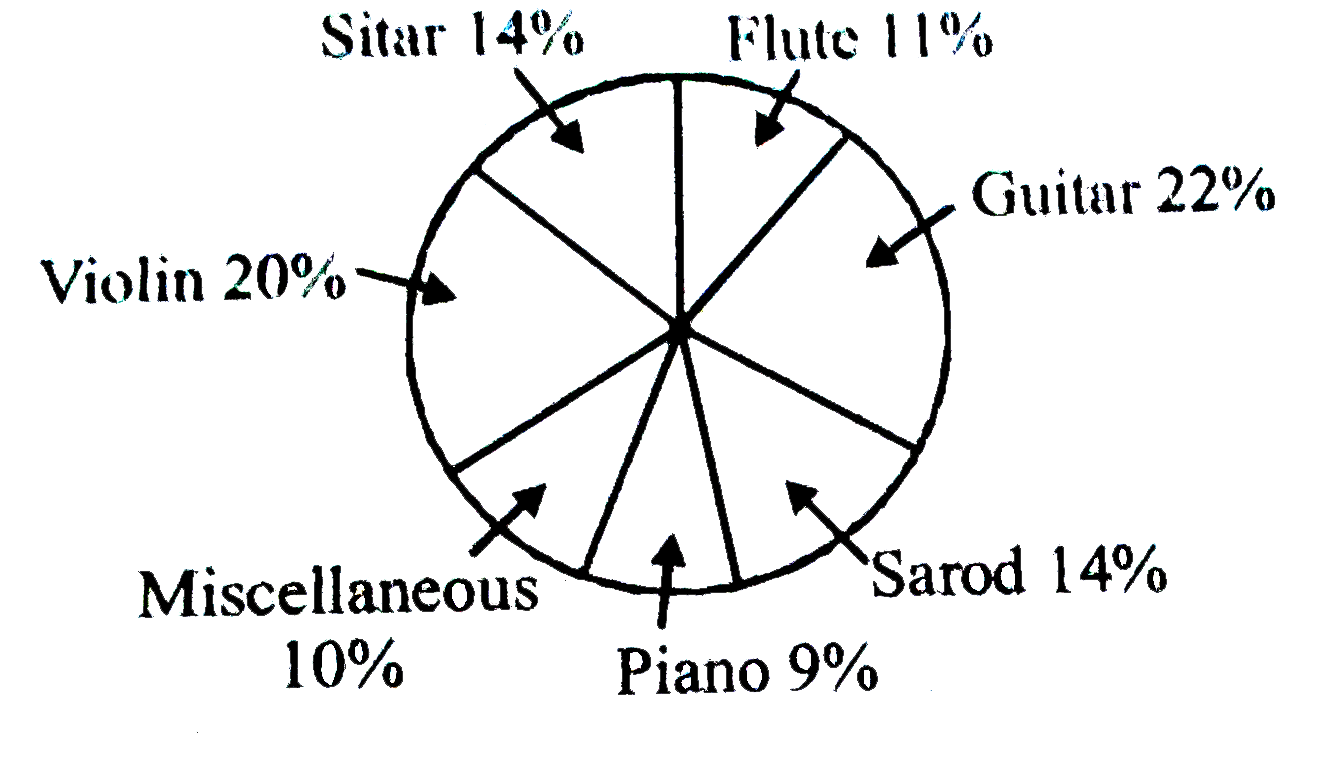
If the following pie-chart shows the preference of musical instruments of 60,000 people surveyed over wholw India.

The number of people who prefer the musical instruments Sarod is :
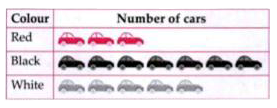
View SolutionThe following pictograph shows the sale of cars of different colours in a showroom.


How many less blue cars were sold than red and gray cars together?
View Solution
Knowledge Check
Which one of the given responses would be a meaningful order of the following colours ?
1. Indigo 2. Red 3. Violet 4. Blue 5. Green 6. Yellow 7. OrangA3, 1, 4, 5, 2, 6, 7B3, 1, 4, 5, 6, 2,7C1, 5, 6, 7, 3, 4, 2D3, 1, 4, 5, 6, 7, 2Simplified value of 712−[214÷{114−12(112−13−16)}] is:
A29B412C912D177228If 30 % of 1520 + 40 % of 800 = x % of 5000, find the value of x.
A18.82%B12.22%C15.52%D14.42%
Answer these questions based on the following information.
There are 2 white candles, 3 red candles, 4 green candles and 3 yellow candles in a brand new packet. All the candles are uniform in shape and size, except their colour, as told above.
Find the number of ways of selecting one candle of each colour.
View SolutionAnswer these questions based on the following information.
There are 2 white candles, 3 red candles, 4 green candles and 3 yellow candles in a brand new packet. All the candles are uniform in shape and size, except their colour, as told above.
Find the number of ways of selecting 4 candles.
View SolutionIf 40% of an amount is 250, what will be 60% of that amount?
View SolutionThe ratio between the speeds of a bus and car is 8:6. If the car travels 200 km in 2 hours, find the speed of the bus.
View SolutionSimplified value of 6−[56+{378−213+179}] is:
View Solution
