The distribtution of fruit consumption in a sample of 72 seventeen - year - old girls is given in the graph below. Study the graph and answer the questions.
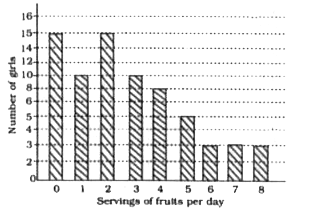
How many of these girls ate fewer than two servings per day ?
15
40
25
None of these
The correct Answer is:C
Step by step video & image solution for The distribtution of fruit consumption in a sample of 72 seventeen - year - old girls is given in the graph below. Study the graph and answer the questions. How many of these girls ate fewer than two servings per day ? by Maths experts to help you in doubts & scoring excellent marks in Class 14 exams.
Updated on:21/07/2023Similar Questions
The distribution of fruit consumption in a sample of 73 seventeen-year-old girls is given in the graph below. Study the graph and answer the questions :
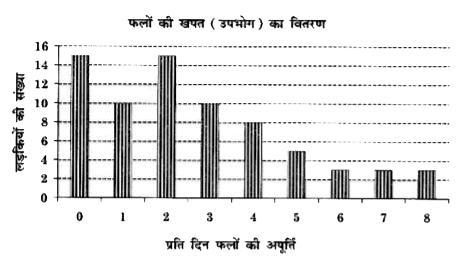
How many of these girls ate fewer than two servings per day?
निम्नलिखित ग्राफ में 72 सत्रह - वर्षीय लड़कियों के सैम्पल में फलों की खपत (उपभोग) के विवरण को दर्शाया गया है। ग्राफ का अध्ययन कीजिए और प्रश्नों के आधार पर उत्तर दीजिए:
इनमें से कितनी लड़कियों ने प्रति दिन दो से कम आपूर्ति किए गए फलों को खाया?
View SolutionThe distribtution of fruit consumption in a sample of 72 seventeen - year - old girls is given in the graph below. Study the graph and answer the questions.
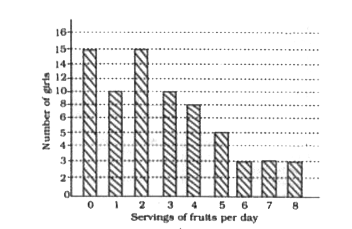
How many of these girls ate more than two servings but less than six servings per day ?
View Solution
Knowledge Check
Study the graph carefully and answer the following questions.
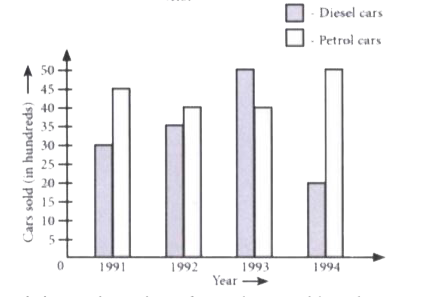
How many cars were sold during the year 1991?A9000B6500C7500D7000Study the graph carefully and answer the following questions.
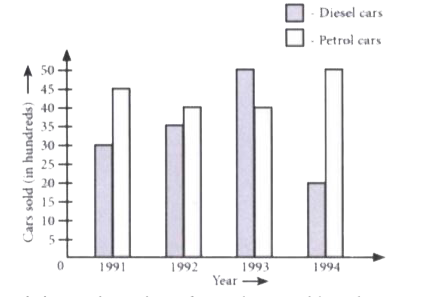
How many more Diesel cars were sold in 1991 than in 1994?A500B1500C1000D2000Observe the bistogram and answer the questions given below
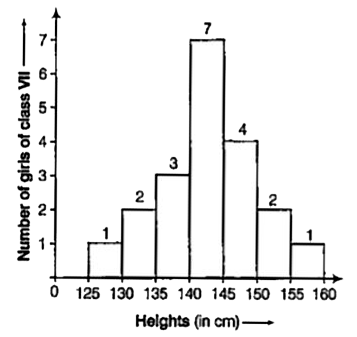
How many girls have a height of 145cm and more?A6B7C5D2
The distribution of fruit consumption in a sample of 72 seventeen - year - old girls is given in the graph below. Study the graph and answer the question.
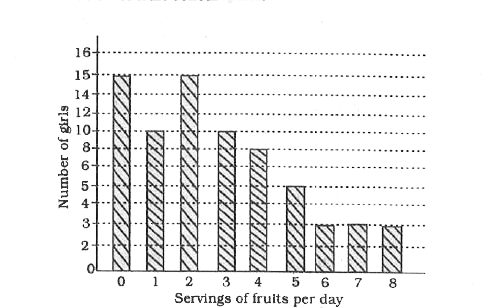
How many of these girls ate more than two servings but less than six serving per day ?
View SolutionThe distribution of fruit consumption in a sample of 73 seventeen-year-old girls is given in the graph below. Study the graph and answer the questions :
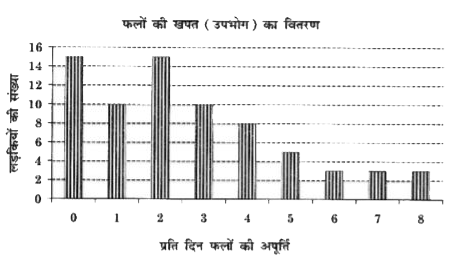
How many of these girls ate more than two servings but less than six servings per day?
निम्नलिखित ग्राफ में 72 सत्रह - वर्षीय लड़कियों के सैम्पल में फलों की खपत (उपभोग) के विवरण को दर्शाया गया है। ग्राफ का अध्ययन कीजिए और प्रश्नों के आधार पर उत्तर दीजिए:
इनमें से कितनों लड़कियों ने प्रति दिन दो से अधिक किन्तु छह से कम आपूर्ति किए गए फलों को खाया?
View SolutionThe distribtution of fruit consumption in a sample of 72 seventeen - year - old girls is given in the graph below. Study the graph and answer the questions.
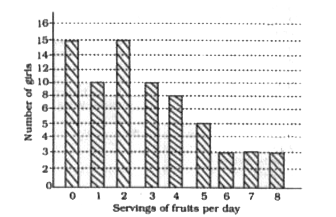
What percent of these girls ate six or more servings per day ?
View SolutionThe distribution of fruit consumption in a sample of 73 seventeen-year-old girls is given in the graph below. Study the graph and answer the questions :
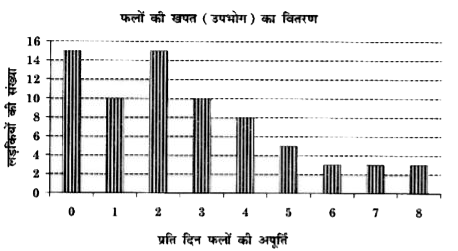
What percent of these girls ate six or more servings per day?
निम्नलिखित ग्राफ में 72 सत्रह - वर्षीय लड़कियों के सैम्पल में फलों की खपत (उपभोग) के विवरण को दर्शाया गया है। ग्राफ का अध्ययन कीजिए और प्रश्नों के आधार पर उत्तर दीजिए:
प्रति दिन छह या अधिक आपूर्ति किए गए फलों को खाने वाली इन लड़कियों का प्रतिशत क्या था?
View SolutionStudy the following graph and answer the question.
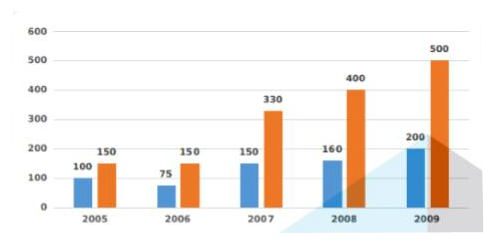
In which year was the value per tonne the minimum?
View Solution
