The pie-chart shows the breakup in percent age of the various expenses of a Company. Study the diagram and answer the following questions. 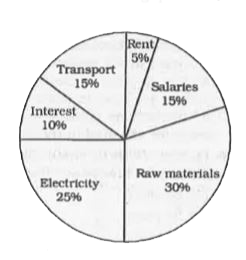
The ratio of company's expenditure on raw material and transport to salaries is:
2:1
1:1
1:2
3:1
The correct Answer is:D
Step by step video & image solution for The pie-chart shows the breakup in percent age of the various expenses of a Company. Study the diagram and answer the following questions. The ratio of company's expenditure on raw material and transport to salaries is: by Maths experts to help you in doubts & scoring excellent marks in Class 14 exams.
Updated on:21/07/2023Similar Questions
The pie-chart shows the breakup in percent age of the various expenses of a Company. Study the diagram and answer the following questions.
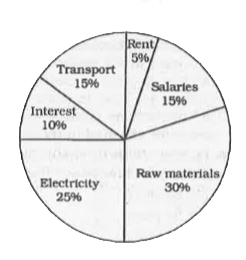
The company's expenditure on interest is greater than expenditure on rent by:
View SolutionThe pie-chart shows the breakup in percent age of the various expenses of a Company. Study the diagram and answer the following questions.
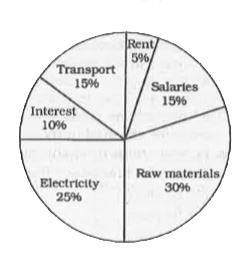
Which is the second biggest expense of the company?
View Solution
Knowledge Check
The pie chart shows the breakup of expenditure of a software company for the year 2017. Study the diagram and answer the following questions.
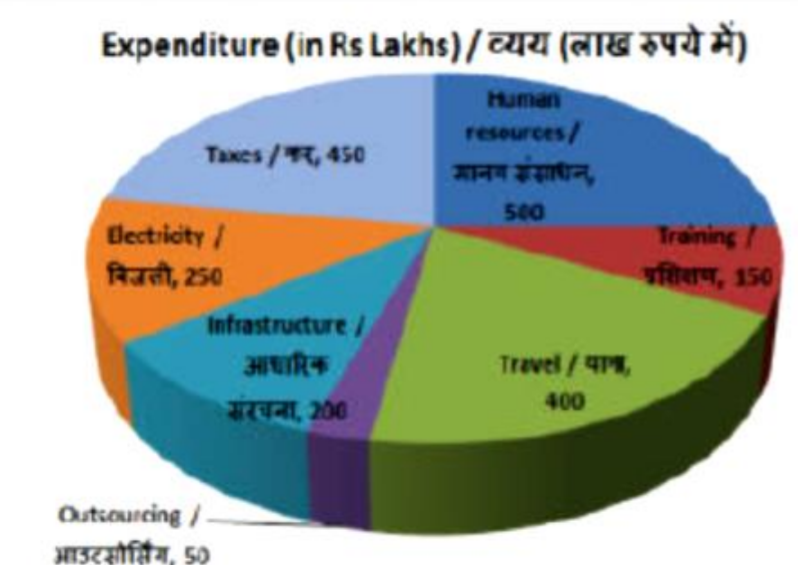
What is the total expenditure (in Rs lakhs)?A2000B1800C2250D2100The pie chart shows the breakup of expendoture of a software company for the year 2017. Study the diagram and answer the following questions.
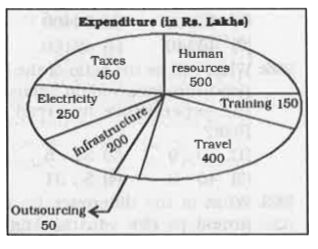
The second highest expenditure is for which item?ATaxesBHuman resourcesCTrainingDTravelThe pie chart shows the breakup of expenditure of a mining company for the year 2017. Study the diagram and answer the following questions.
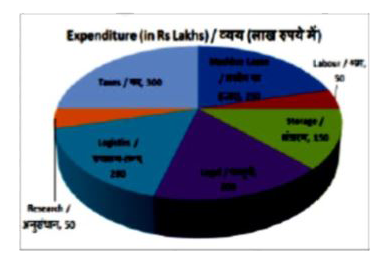
What is the total expenditure (in Rs lakhs)?A1200B900C1000D1100
The pie-chart shows the breakup in percent age of the various expenses of a Company. Study the diagram and answer the following questions.
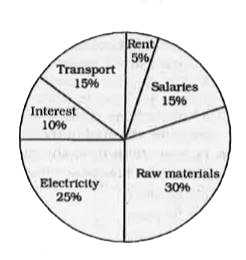
If the total expenses of the company are Rs 50 crores. The total expenditure (in Rs. Crores) on transport and electricity is:
View SolutionThe pie chart shows the breakup of expendoture of a software company for the year 2017. Study the diagram and answer the following questions.

The second highest expenditure is for which item?
View SolutionThe pie chart shows the breakup of expendoture of a software company for the year 2017. Study the diagram and answer the following questions.
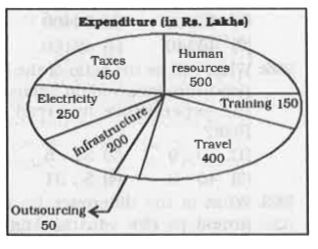
What is the total expenditure (in Rs. lakhs)?
View SolutionThe pie chart shows the breakup of expenditure of a college for the year 2017. Study the diagram and answer the following questions.
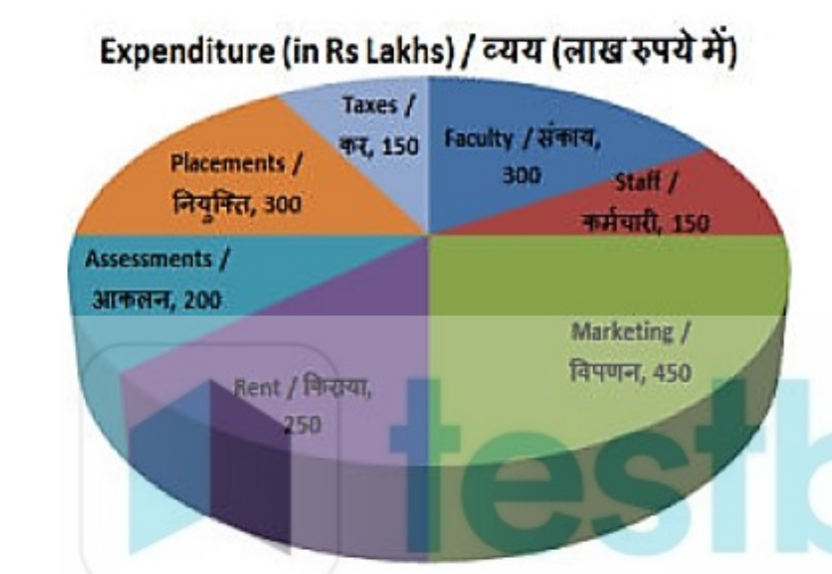
What is the total expenditure (in Rs lakhs)?
View SolutionThe pie chart shows the breakup of expenditure of a college for the year 2017. Study the diagram and answer the following questions.
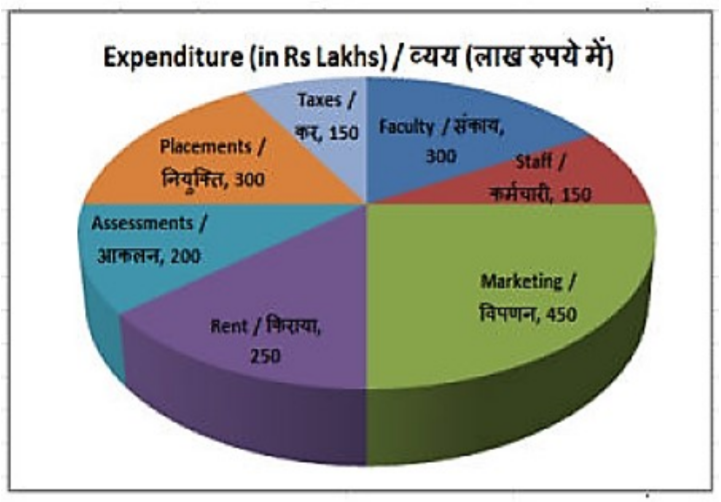
The highest expenditure is for which item?
View Solution
