The graph shows the result of 10th class students of a school for 4 years. Study the graph and answer the questions :
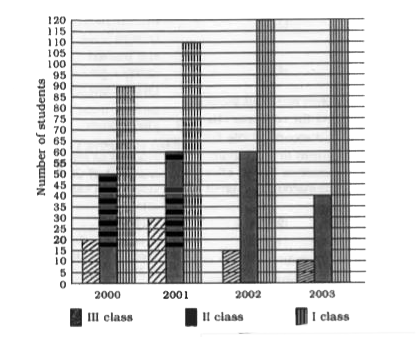
The ratio of students who scored seconds class to the total students appcarcd in the year 2000 is
3:16
4:17
5:16
11:16
The correct Answer is:C
Step by step video & image solution for The graph shows the result of 10th class students of a school for 4 years. Study the graph and answer the questions : The ratio of students who scored seconds class to the total students appcarcd in the year 2000 is by Maths experts to help you in doubts & scoring excellent marks in Class 14 exams.
Updated on:21/07/2023Similar Questions
The graph shows the result of 10th class students of a school for 4 years. Study the graph and answer the questions :
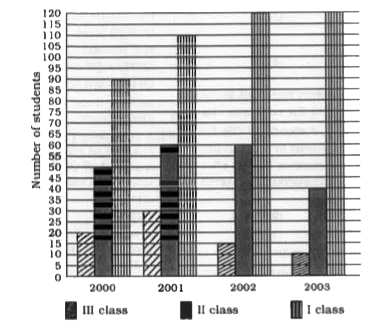
The number of students appeared for the 10th calss examin the year 2002 is
View SolutionThe graph shows the result of 10th class students of a school for 4 years. Study the graph and answer the questions :
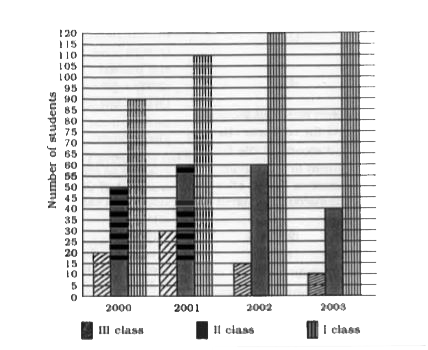
The year in which the maximum number of students appeared for the 10th class exam is
View SolutionThe graph shows the result of 10th class students of a school for 4 years. Study the graph and answer the questions:
The number of students appeared for the 10th class exam in the year 2002 is.
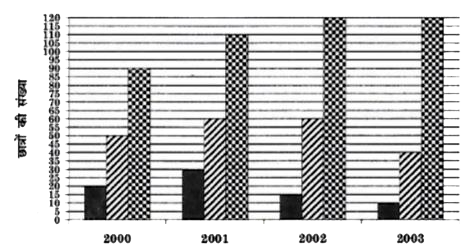
निम्नलिखित दण्ड आरेख 10 वीं कक्षा के छात्रों का 4 वर्ष का परीक्षा परिणाम दर्शाता है। आरेख का अध्ययन कीजिए और निम्नलिखित प्रश्नों का उत्तर दीजिए : छात्रों की संख्या
वर्ष 2002 में 10 वीं कक्षा की परीक्षा में शामिल छात्रों की संख्या बताइए:
View SolutionThe graph shows the result of 10th class students of a school for 4 years. Study the graph and answer the questions :
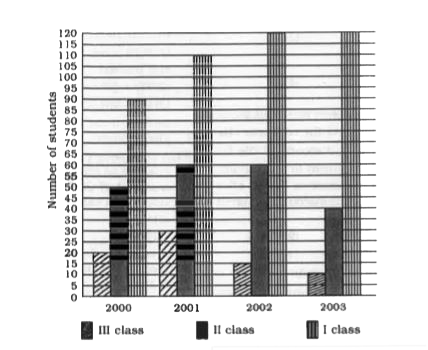
The percentage increase of first class in the year 2003 over the year 2002 is approximately
View SolutionThe sub divided bar diagram given below depicts the result of Class XII students of a school for three years. Study the diagram and answer the questions given below :
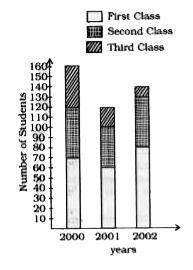
The percenatge of students passed with Second class in the year 2000 is
View SolutionThe sub divided bar diagram given below depicts the result of Class XII students of a school for three years. Study the diagram and answer the questions given below :
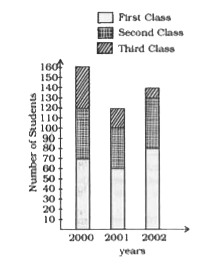
The number of students passed with Second class in th year 2002 is
View SolutionThe sub divided bar diagram given below depicts the result of Class XII students of a school for three years. Study the diagram and answer the questions given below :
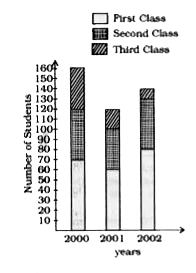
The percenatge of students passed with First class in the year 2001 is
View SolutionThe sub divided bar diagram given below depicts the result of Class XII students of a school for three years. Study the diagram and answer the questions given below :
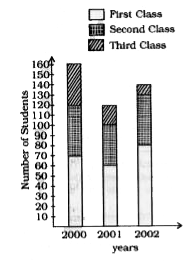
The number of students passed with Third class in th year 2002 is
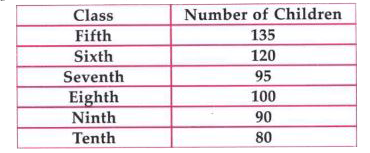
View SolutionAnswer the following questions
Find the ratio of students of class sixth to the students of class eight
View SolutionThe sub-divided bar diagram given below depicts the result of B.Com. Students of a college for 3 years. Study the graph and answer the given questions.
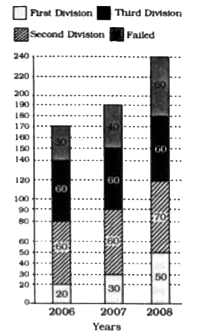
How many percent of students passed in first division in 2007?
View Solution
