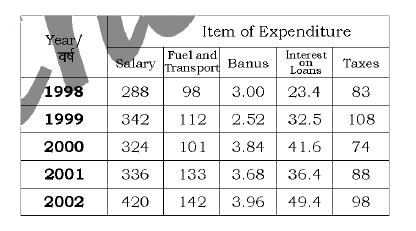
Table shows the annual Ex-penditure of a Company ( in Lakh Rupess) over the year .
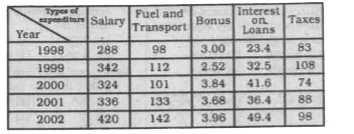
What is the average amount of Tax( in Lakh rupees) which the company paid during the period 1998 to 2002?
100
The correct Answer is:B
Step by step video & image solution for Table shows the annual Ex-penditure of a Company ( in Lakh Rupess) over the year . What is the average amount of Tax( in Lakh rupees) which the company paid during the period 1998 to 2002? by Maths experts to help you in doubts & scoring excellent marks in Class 14 exams.
Updated on:21/07/2023Similar Questions
The bar graph given below shows the data of the production of paper (in lakh tonnes) by three different companies P, Q and R over the years.
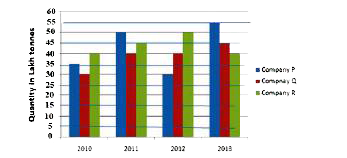
What is the ratio of the average production by company P during the period 2010 to 2013 to the average production by company R during the same period?
View SolutionComprehesion:
Study the following table and answer the question besed on it.
Following table gives the expenditures of a company (in lakh rupees) per annum over the given years.
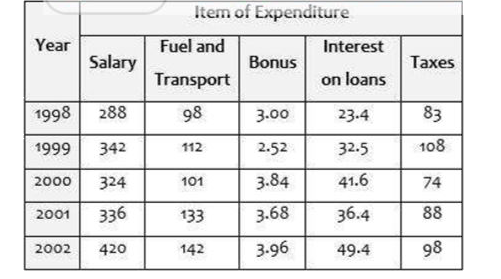
The total expanditure of the company over the items diring the years 2001 is -
View Solution
Knowledge Check
Table shows the annual Expenditure of a Company ( in Lakh Rupees ) over the years.
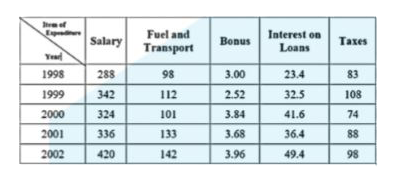
What is the average amount of Tax ( in Lakh rupees) which the company paid during the period 1998 to 2002 ?A82.2B90.2C100D88.2Table shows the annual Expenditure of a company over the years
What is the average amount of Interest on loans which the company paid during the period 1998 to 2002?A33.72B34.18C32.43D36.66The following table shows the items of expenditure of a company (in ₹ lakh per annum), from 2015 to 2019.
निम्नलिखित तालिका 2015-2019 तक एक कंपनी के व्यय की मदों को ( लाख रुपये प्रति वर्ष में ) दर्शाती है | What is the average amount of interest per year which the company had to pay during this
period?
इस अवधि के दौरान प्रति वर्ष कंपनी को ब्याज की कितनी औसत राशि का भुगतान करना पड़ा है ?ARs. 35 lakhBRs. 34.7 lakhCRs. 25 lakhDRs. 30.7 lakh
Comprehesion:
Study the following table and answer the question besed on it.
Following table gives the expenditures of a company (in lakh rupees) per annum over the given years.
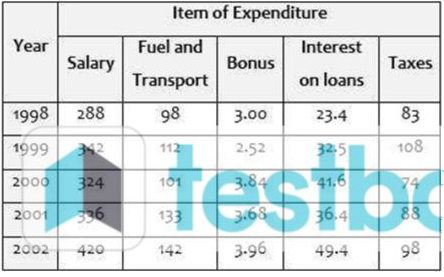
The ratio between the total expenditure on taxes for all years tro the Bonus for all the years respectively is?
View SolutionIn the given bar graph , the white bar shows the income and the black bar shows the expenditure of company (in Rs. Lakhs) . Study the graph and answer the question that follows .
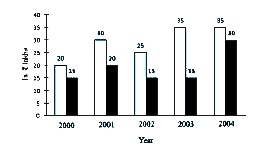
The percentage decrease in the income of the company in 2002 as compared to that in 2001 is :
View SolutionComprehesion:
Study the following table and answer the question besed on it.
Following table gives the expenditures of a company (in lakh rupees) per annum over the given years.
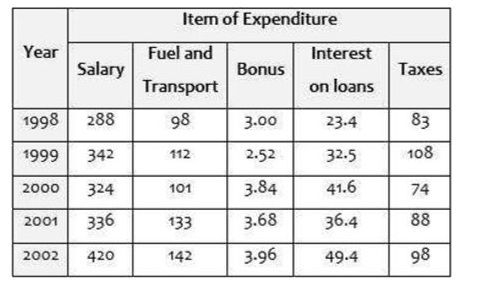
Experditure on Fule and Transport forms what percenteg of expenditure on Selery for the year 2001?
View SolutionThe following table shows the annual profit of a company (in Rs. lakh).

The period which has the maximum percentage increase in profit over the previous year is:
View SolutionThe following graph shows the production of cotton cloth (in lakh metres) by three companies A, B and C over the years.
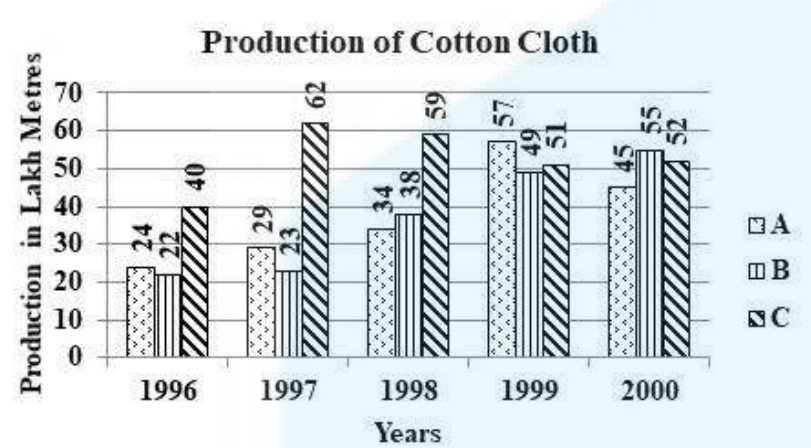
What is the ratio of the production of Company C in the years 1996 and 1997 to the production of Company B in the years 1999 and 2000?
View Solution
