What is the ratio between the average number of students enrolled with all colleges together in 2007 and 2008, respectively?
108:113
108:117
110:113
111:113
The correct Answer is:C
To find the ratio between the average number of students enrolled in all colleges together in 2007 and 2008, we will follow these steps:
1. Identify the Enrollment Data for 2007:
- From the table, the number of students enrolled in 2007 are:
- College 1: 460
- College 2: 360
- College 3: 430
- College 4: 470
- College 5: 480
2. Calculate the Total Enrollment for 2007:
- Total = 460 + 360 + 430 + 470 + 480
- Total = 2200
3. Calculate the Average Enrollment for 2007:
- Average = Total Enrollment / Number of Colleges
- Average = 2200 / 5
- Average = 440
4. Identify the Enrollment Data for 2008:
- From the table, the number of students enrolled in 2008 are:
- College 1: 470
- College 2: 340
- College 3: 390
- College 4: 530
- College 5: 530
5. Calculate the Total Enrollment for 2008:
- Total = 470 + 340 + 390 + 530 + 530
- Total = 2260
6. Calculate the Average Enrollment for 2008:
- Average = Total Enrollment / Number of Colleges
- Average = 2260 / 5
- Average = 452
7. Calculate the Ratio of Average Enrollments:
- Ratio = Average in 2007 : Average in 2008
- Ratio = 440 : 452
8. Simplify the Ratio:
- To simplify, we can divide both sides by 4:
- Ratio = (440 ÷ 4) : (452 ÷ 4)
- Ratio = 110 : 113
Final Answer:
The ratio between the average number of students enrolled in all colleges together in 2007 and 2008 is 110 : 113.
---
- From the table, the number of students enrolled in 2007 are:
- College 1: 460
- College 2: 360
- College 3: 430
- College 4: 470
- College 5: 480
- Total = 460 + 360 + 430 + 470 + 480
- Total = 2200
- Average = Total Enrollment / Number of Colleges
- Average = 2200 / 5
- Average = 440
- From the table, the number of students enrolled in 2008 are:
- College 1: 470
- College 2: 340
- College 3: 390
- College 4: 530
- College 5: 530
- Total = 470 + 340 + 390 + 530 + 530
- Total = 2260
- Average = Total Enrollment / Number of Colleges
- Average = 2260 / 5
- Average = 452
- Ratio = Average in 2007 : Average in 2008
- Ratio = 440 : 452
- To simplify, we can divide both sides by 4:
- Ratio = (440 ÷ 4) : (452 ÷ 4)
- Ratio = 110 : 113
The ratio between the average number of students enrolled in all colleges together in 2007 and 2008 is 110 : 113.
Topper's Solved these Questions
- DATA TABLE BOOK - ARIHANT SSCCHAPTER - DATA TABLE EXERCISE - HIGHER SKILL LEVEL QUESTIONS
25 Videos
- DATA TABLE BOOK - ARIHANT SSCCHAPTER - DATA TABLE EXERCISE - HIGHER SKILL LEVEL QUESTIONS
25 Videos
- DATA SUFFICIENCYBOOK - ARIHANT SSCCHAPTER - DATA SUFFICIENCYEXERCISE - FAST TRACK PRACTICE
30 Videos
- DISCOUNTBOOK - ARIHANT SSCCHAPTER - DISCOUNTEXERCISE - FAST TRACK PRACTICE
47 Videos
Similar Questions
Knowledge Check
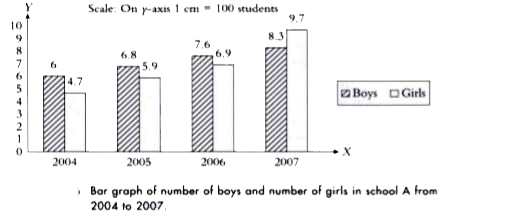
Find the ratio between the number of students in the year 2006 and in 2007.A107:145B127:145C29:36D107:127What is the average of the number of students in the arts stream in all the colleges taken together?
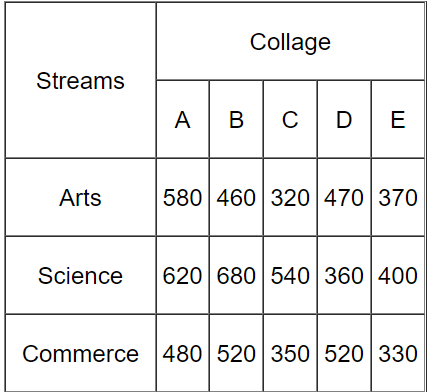 A450B470C440D460
Study the following graph carefully and answer the questions that follow
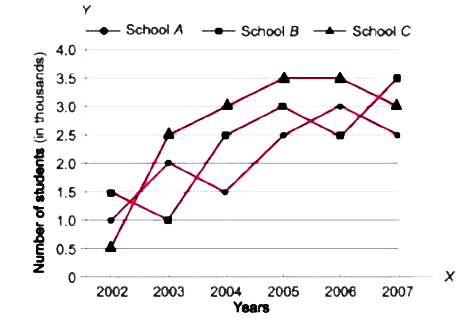
What was the average number of students in all schools together in the year 2006 ?A30000B9000C3000D6000
What is the ratio of students taken for all years together from school B to that from from school A?
View SolutionWhat is the average number of students from the science discipline of all the colleges taken together?
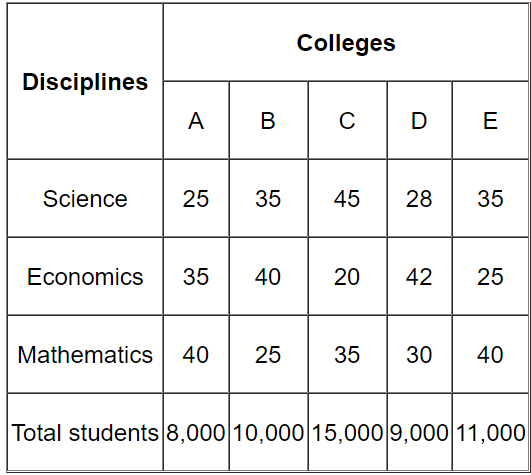
View SolutionThe table below shows the number of students enrolled in five colleges over the five years
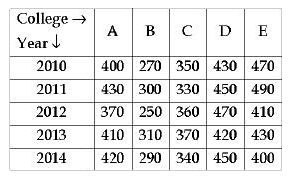
In the year 2014 what percent of students were enrolled in college C
View SolutionWhat is the average number of students studying commerce from all the institutes together?
View SolutionStudy the following graph which shows the production (in thousand) of different items, and answer the questions.

The ratio between the number of keyboards produced by the company in the year 2006, 2007 and 2008 respectively is
View Solution

